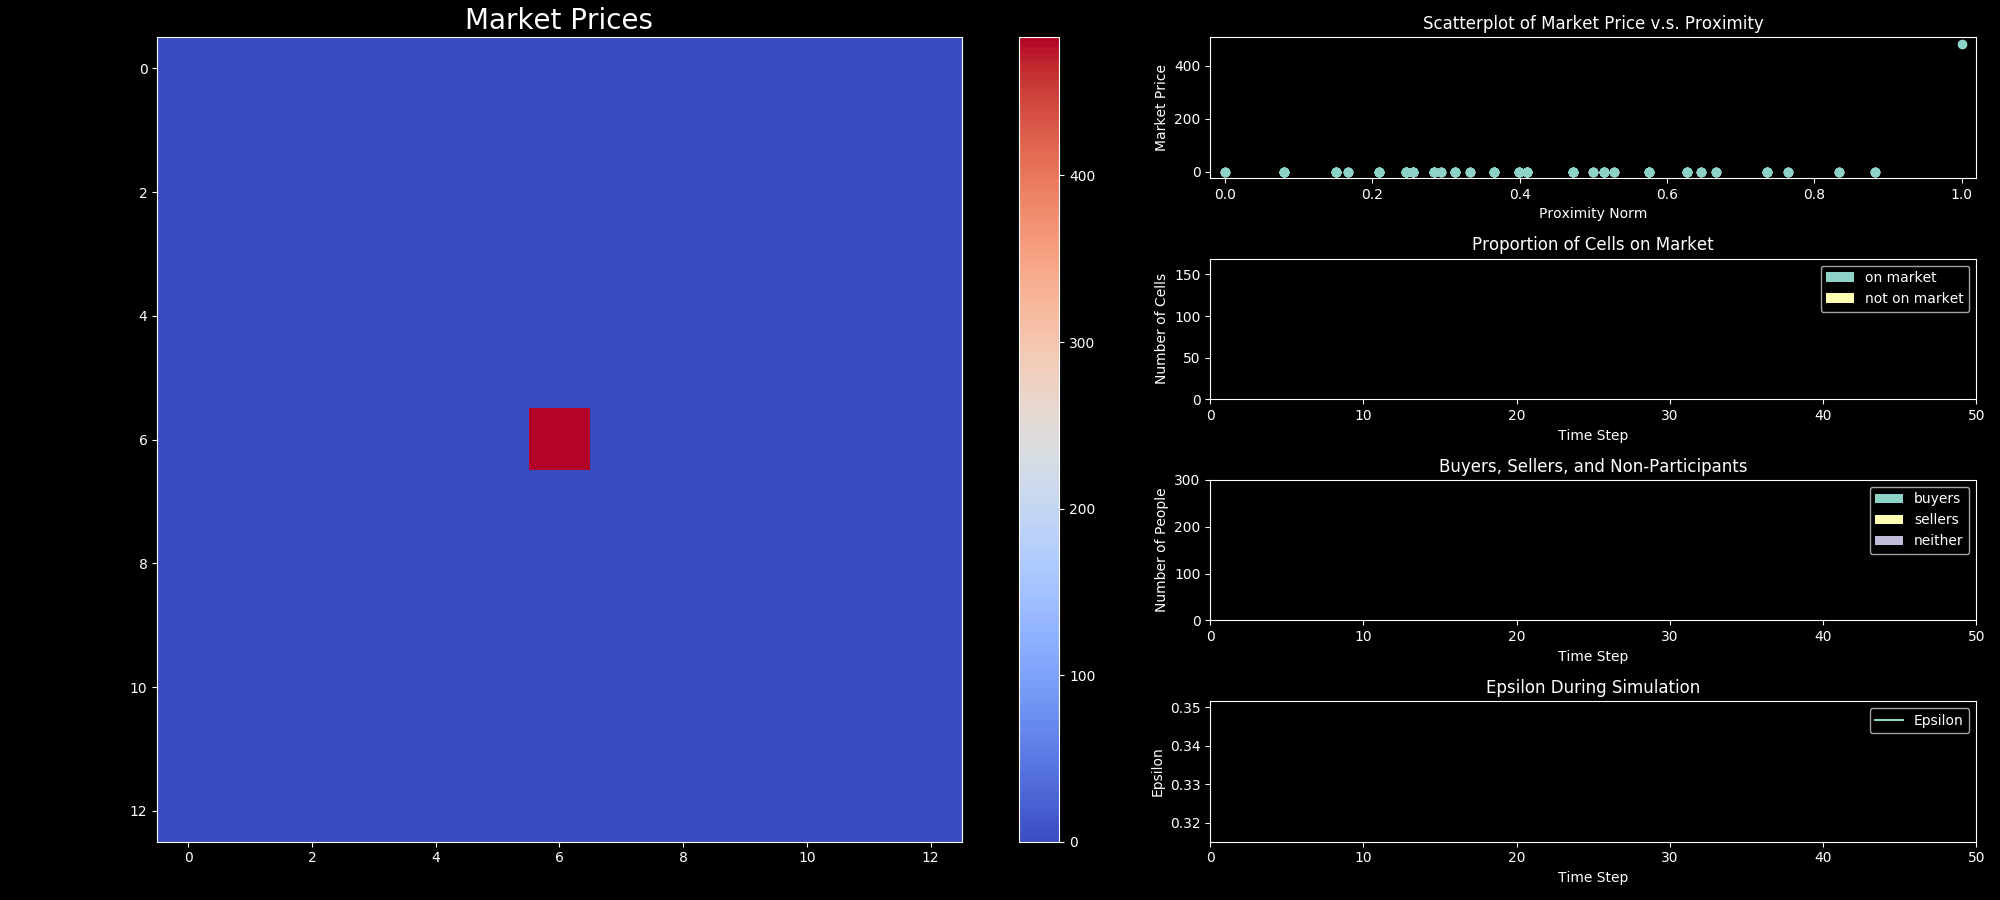
Urban land markets exhibit complex emergent behaviors that have yet to be fully explained by the microeconomic decision-making which constitutes the market. The Agent-based Land MArket (ALMA) framework has been introduced to simulate a bilateral agent-based land market that produces a rent gradient. In this paper, we extend the ALMA framework by introducing two new parameters, heterogeneity, and stochasticity which allow us to explore how the rent gradient is affected by buyers with diverse preferences and a range of market compositions.
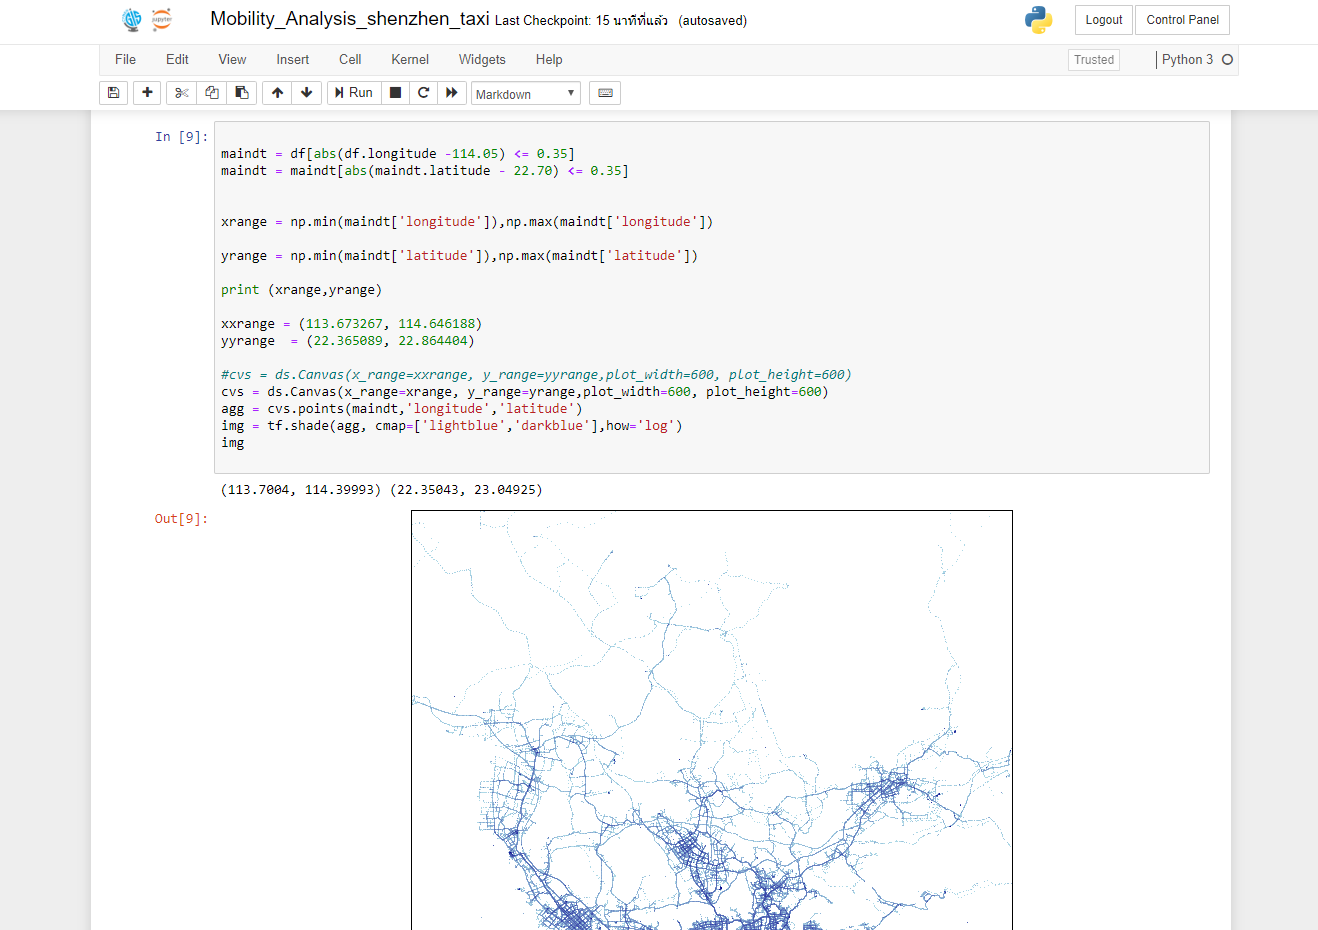
This notebook shows the visual analytics for the Shenzhen taxi trajectories, including histogram distribution graph, heatmaps for different constraints, and heatmap with time information with taxi trip data collected from Shenzhen. Data information was described in Cheng et al. 2019.
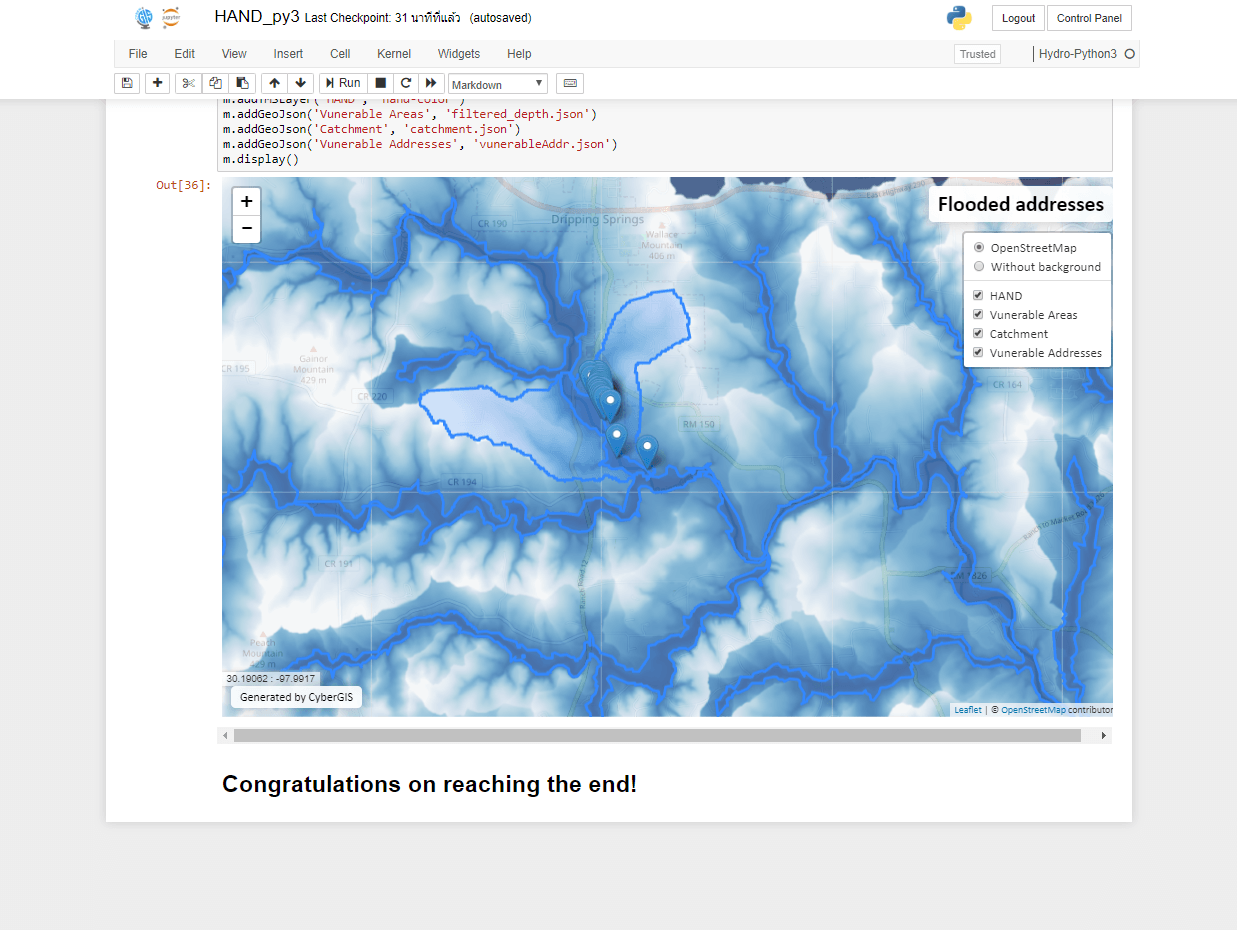
This Jupyter notebook illustrates the HAND workflow and its use in example flood emergency scenarios. The study area is Onion Creek (HUC10 code 1209020504). This is also a demonstration of conducting geospatial analysis with open-source toolkits (gdal) using an online Jupyter interface.
Surface water is an irreplaceable strategic resource for human survival and social development. The accurate delineation of hydrological streamlines is critically important in various scientific disciplines, such as the assessment of present and future water resources, climate models, agriculture suitability, river dynamics, wetland inventory, watershed analysis, surface water survey and management, flood mapping, and environment monitoring. Traditional hydrologic models generate streamlines solely based on topologic information, which inevitably contain errors. For example, dried out drainage lines would always be falsely recognized as streamlines. The traditional method also ignores the information from the complex 3D environment of streamlines and surface reflectance information, which would potentially be very helpful to accurately delineate streamlines. In recent years, the availability of high accuracy LiDAR data provides us a promising method to capture both 3D information of the environment and also surface reflectance information of land cover. LiDAR sensors use NIR light in the form of a pulsed laser to measure ranges (variable distances) to the ground and also reflectance information with multiple returns. These light pulses generate precise, three-dimensional information about the shape of the surface characteristics. In this research, multiple LiDAR feature maps are generated, and we develop a U-net model for doing the streamline detection and we also test several traditional machine learning methods as our baseline for comparison. Our accuracy evaluation shows that our U-net model is able to outperform the best baseline method by 8.08% on average in F1-score and provide better smoothness and connectivity over the classified streamline channels.
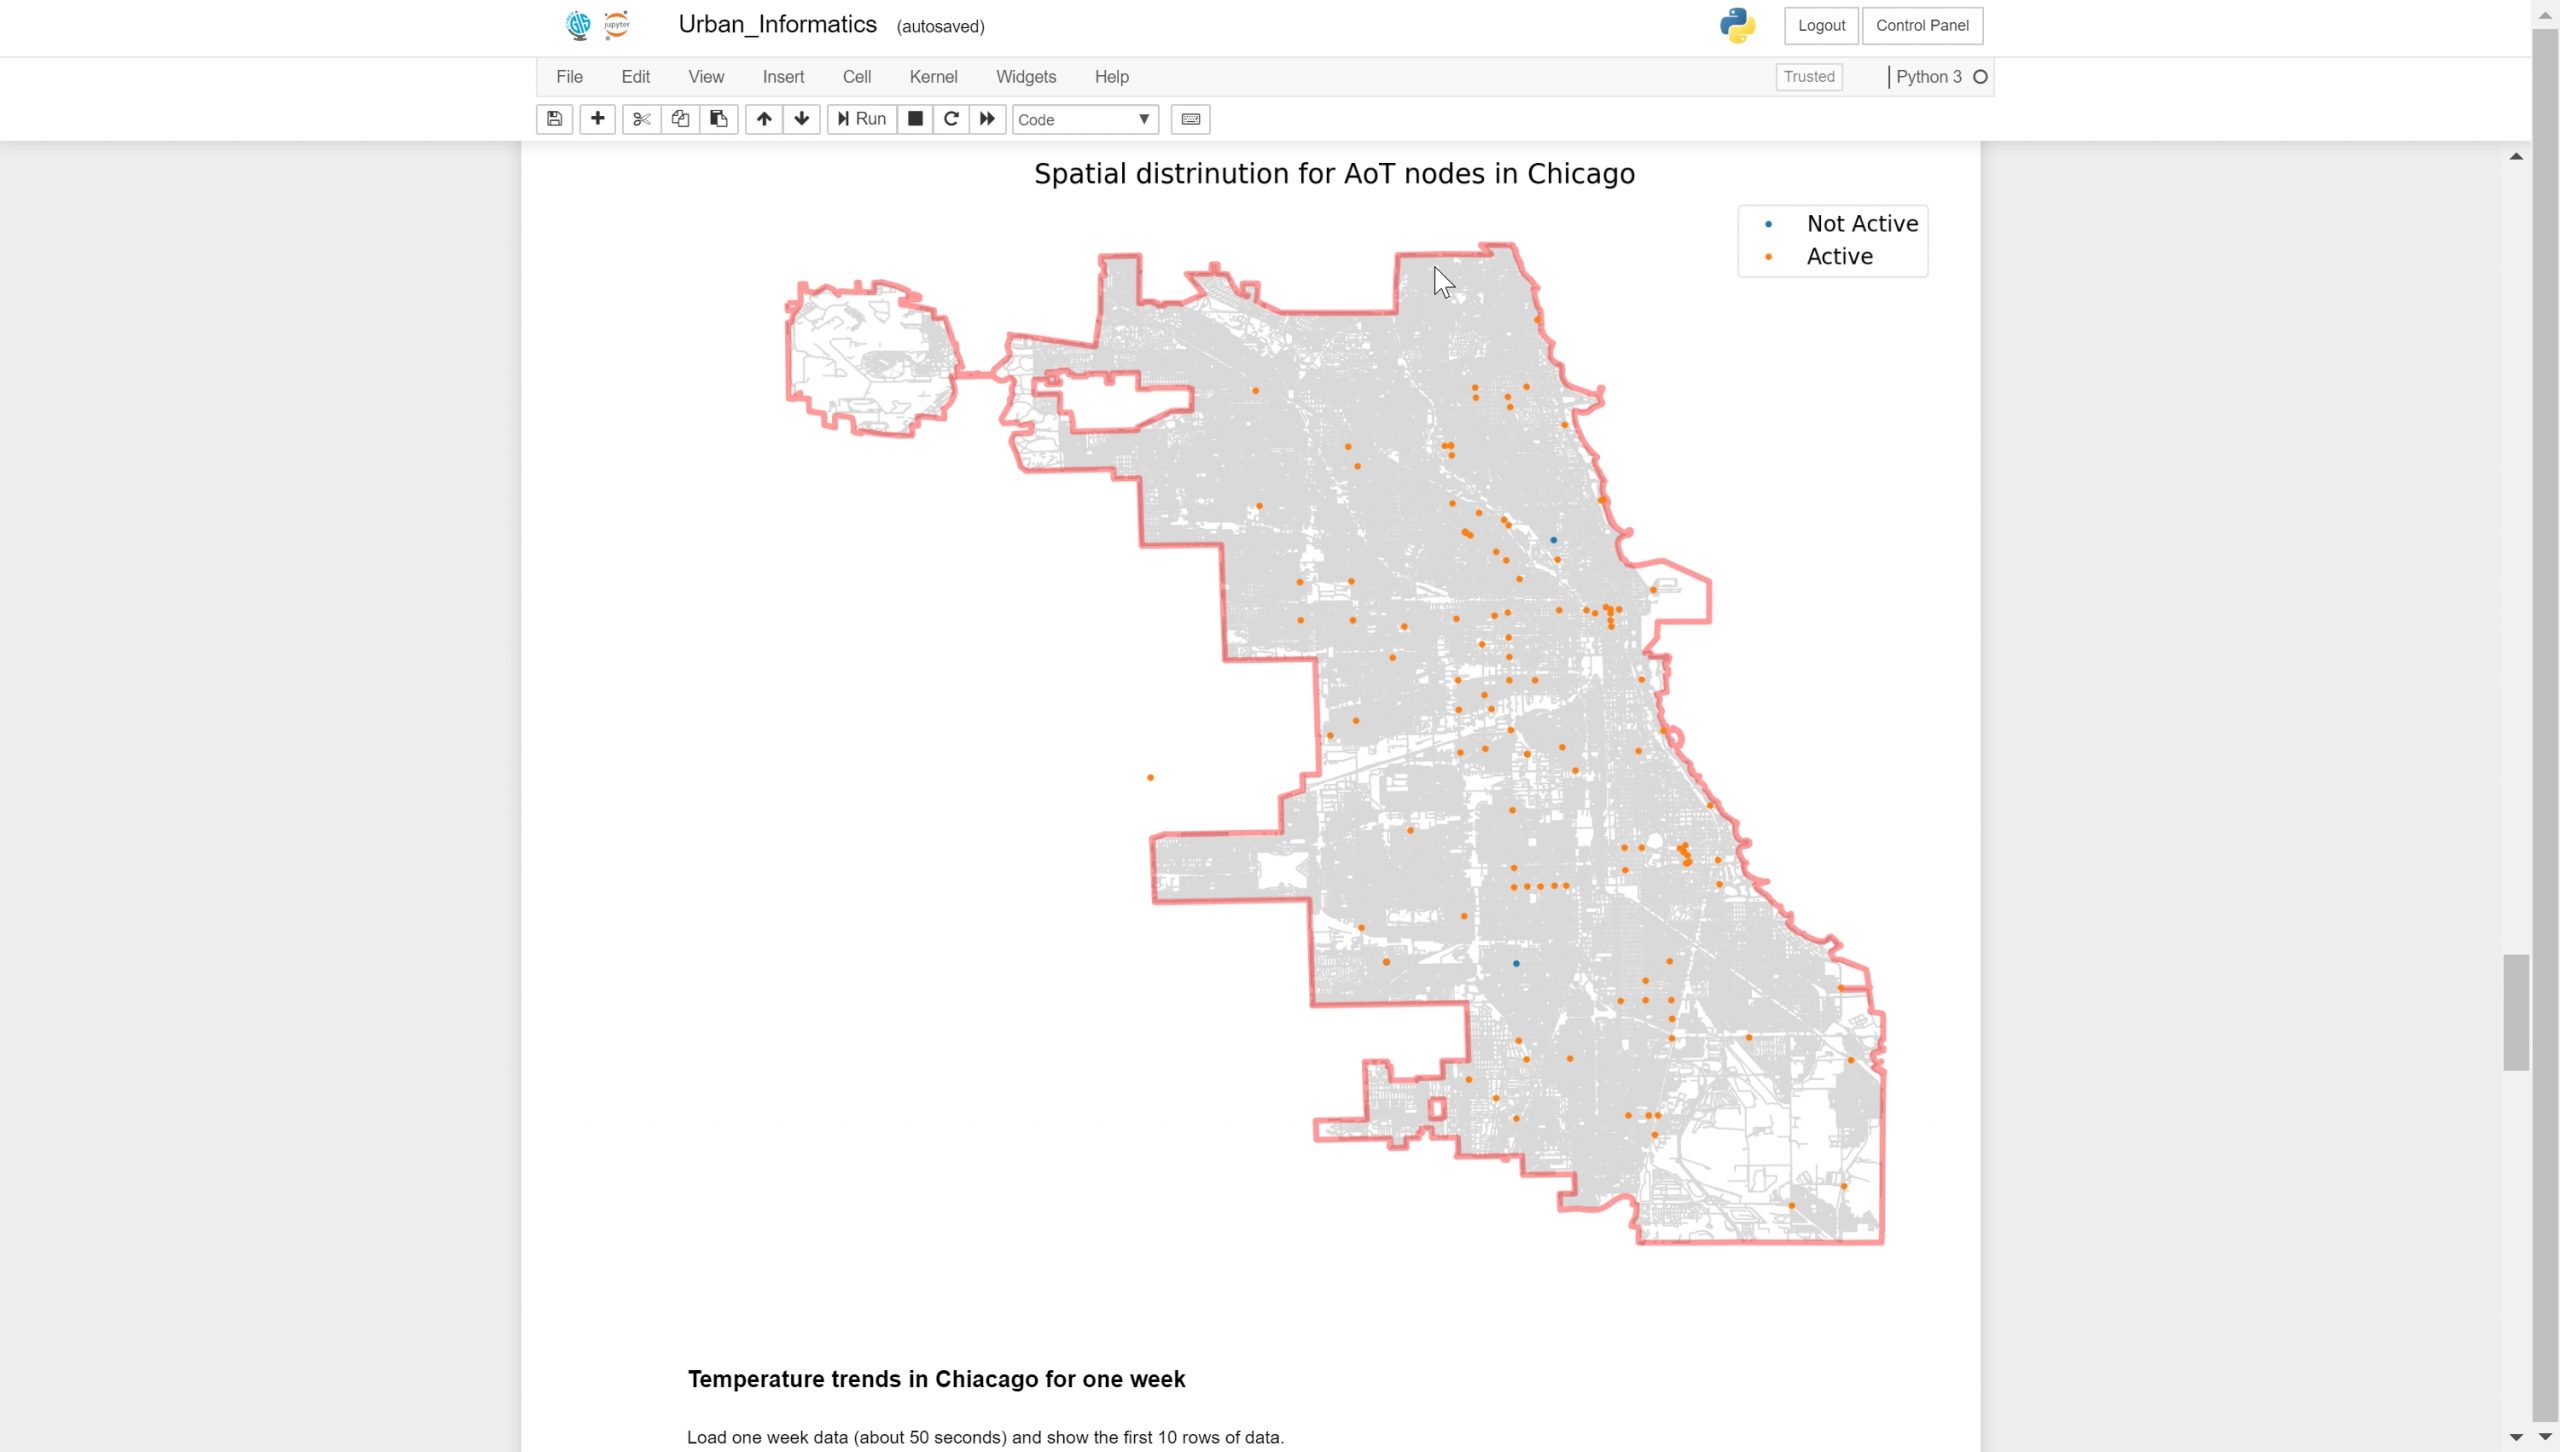
This Jupyter notebook demonstrates the book chapter named Integrating CyberGIS and Urban Sensing for Reproducible Streaming Analytics, including showing the locations for AoT sensors and the temperature curve for AoT nodes in Chicago.
This notebook introduces Jupyter Notebooks as a way to present code and analysis on CyberGISX. The topic is covered in more depth compared to the Quick Start notebook.
This is a brief introduction to the Python programming language.
This is a quick intro to using Jupyter Notebooks within CyberGISX.
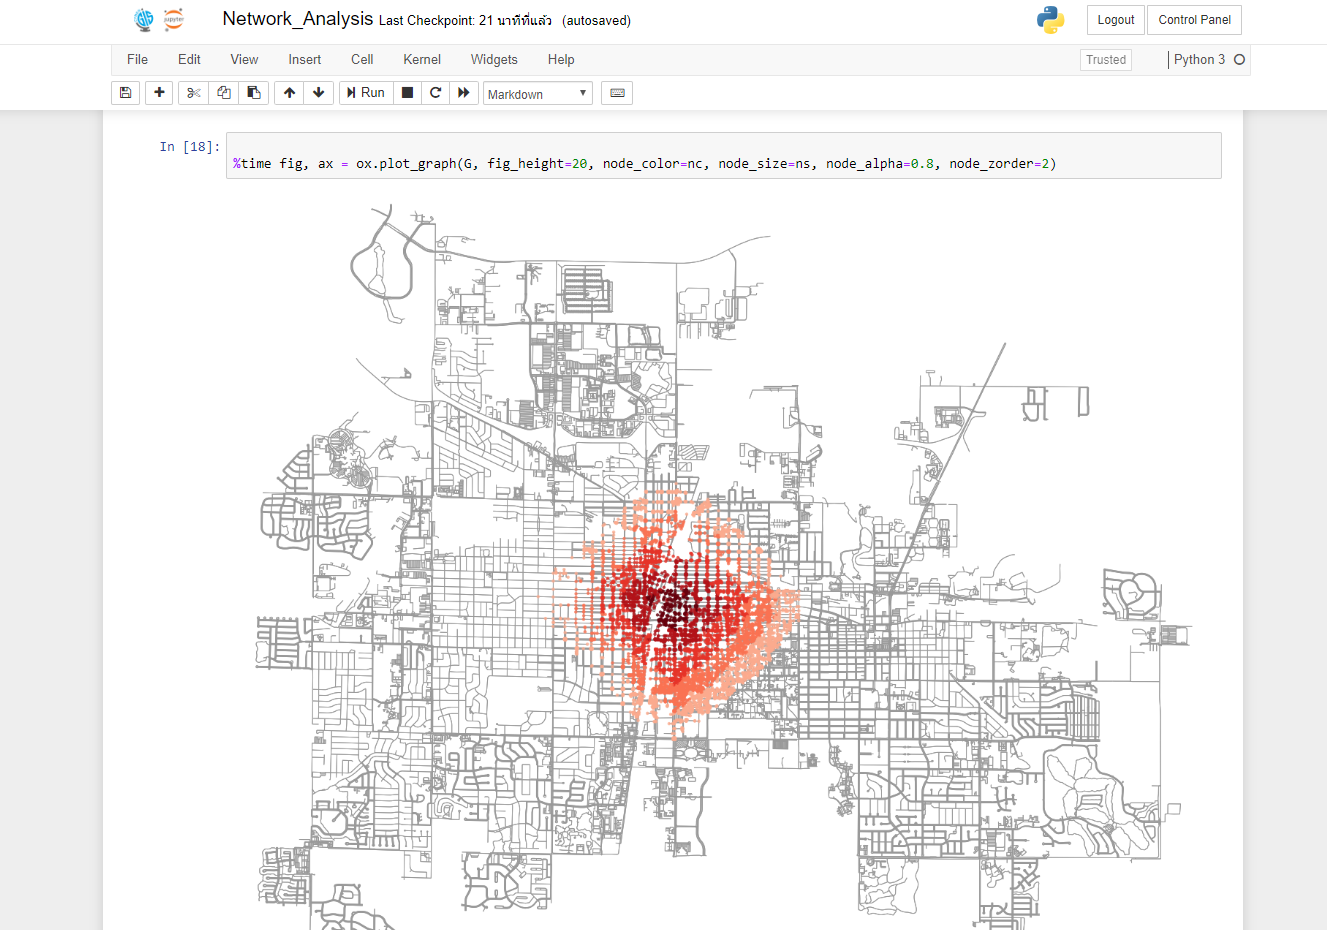
This Jupyter notebook demonstrates the network analysis, including finding the shortest path and generate isochrones from the road network accessibility. We are using Urbana-Champaign, IL as our study area. And this notebook uses geospatial libraries to simulate the shortest path from point to another and isochrones analysis with the problem of road network accessibility.
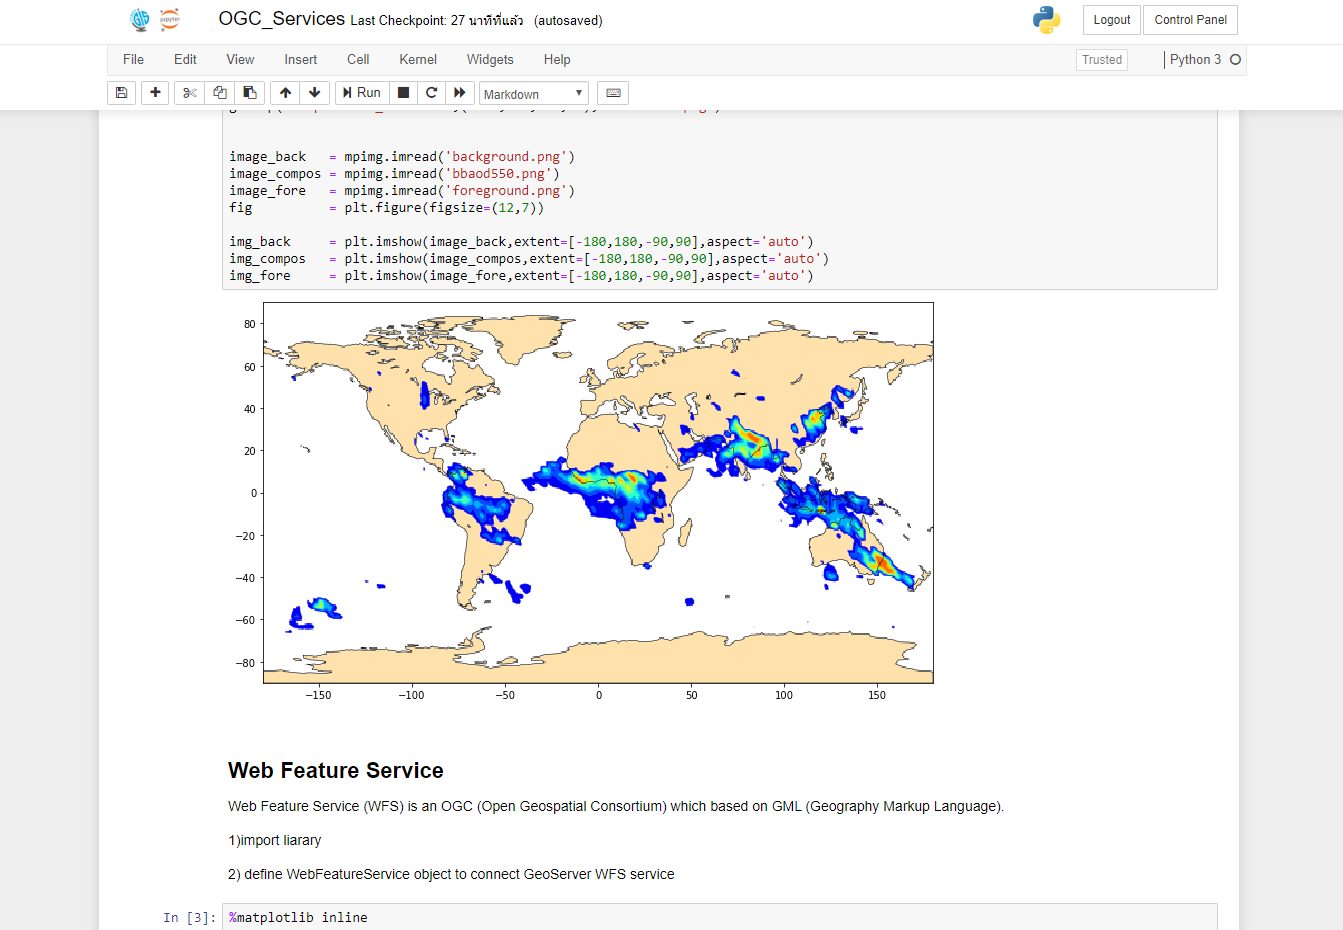
This is an interactive jupyter notebook that shows users how to access OGC services using owslib. OWSLib is a Python package for client programming with Open Geospatial Consortium (OGC) web service interface standards, including WMS, WFS, WMTS, WCS, and SOS (https://geopython.github.io/OWSLib/).
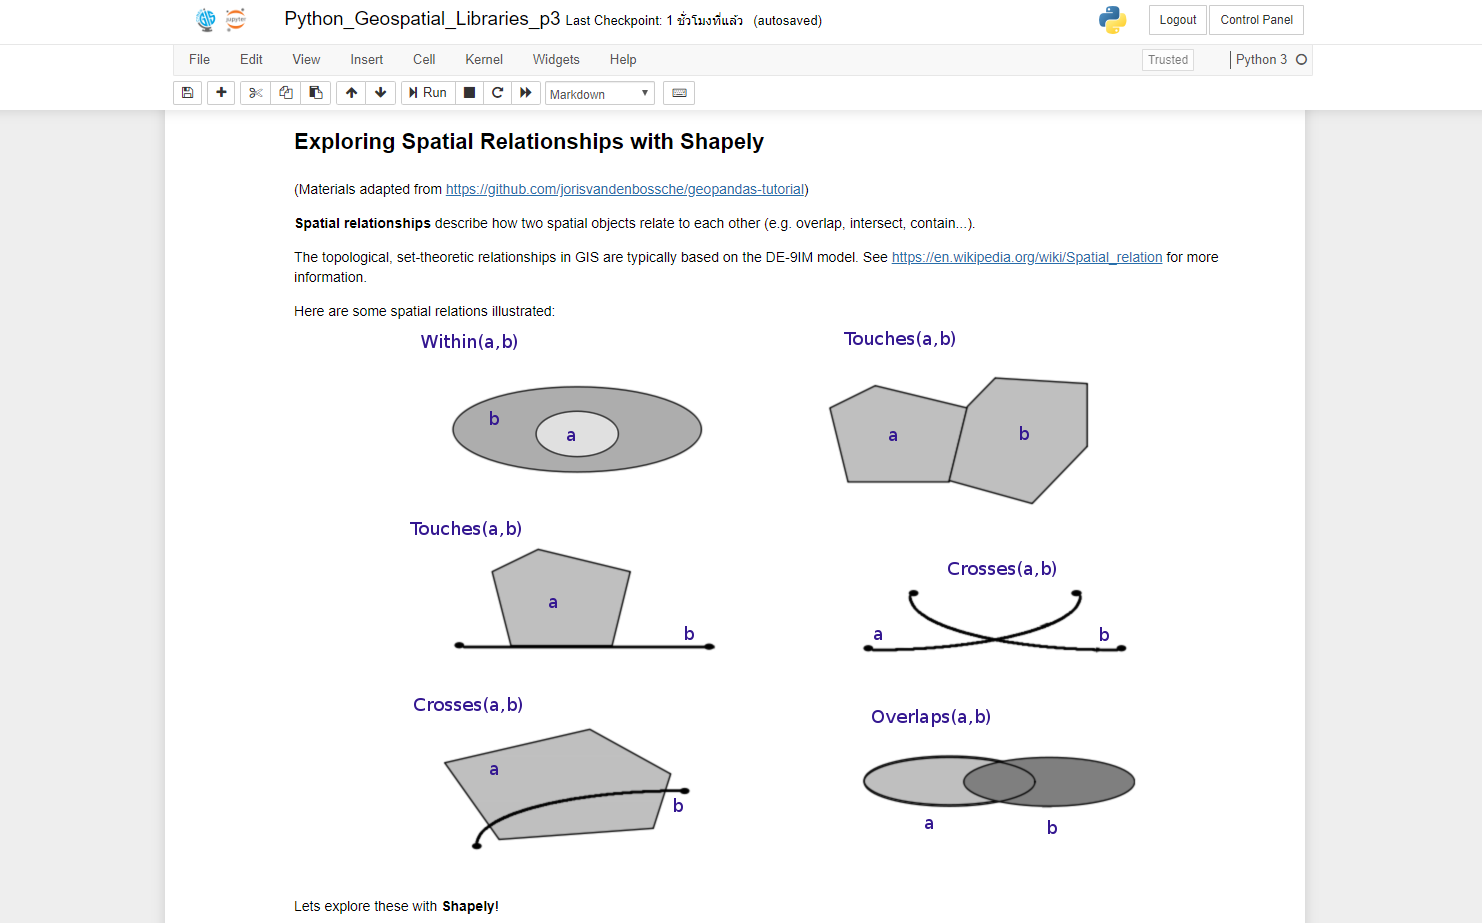
This notebook provides an introduction to Python Geospatial Libraries, mainly GeoPandas (including aspects of Pandas), and Shapely.
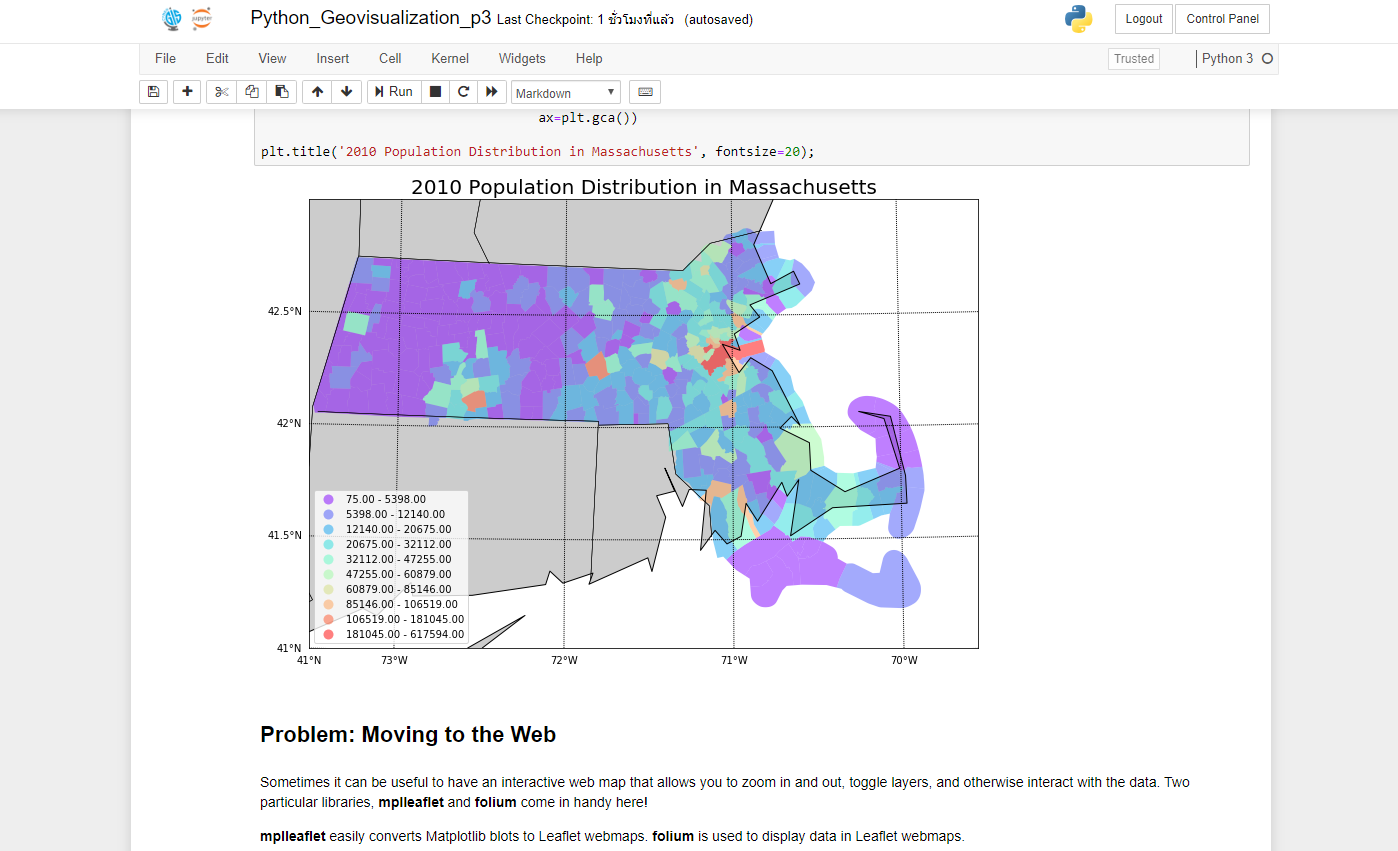
This notebook provides an introduction to Geovisualization using Python. Both the Matplotlib family and HTML-based visualization are covered.
CyberGIS-Jupyter for Water (CJW), leveraging the cyberGIS software ecosystem, is integrated with HydroShare. CJW provides a collaborative platform for enabling computationally intensive and reproducible hydrologic research by delivering advanced cyberinfrastructure and cyberGIS capabilities based on high-performance computing (HPC) resources such as Virtual ROGER and XSEDE Comet. The Structure For Unifying Multiple Modeling Alternatives (SUMMA), which is a hydrological modeling framework, allows for formal evaluation of multiple working hypotheses on model representations of physical processes. This CyberGIS-Jupyter notebook illustrates specific support for a SUMMA model on top of the cutting-edge hydrologic modeling capabilities on CJW. By taking advantage of CJW, users can easily tune different parameters for a SUMMA model and submit computationally intensive High-Throughput Computing (HTC) jobs for executing the model on HPC resources via Jupyter notebooks without having to possess in-depth technical knowledge about cyberGIS or HydroShare. Computational experiments demonstrate that the integration of cyberGIS capabilities and HydroShare achieves a high-performance and easy-to-use environment for reproducible SUMMA-based hydrological modeling.
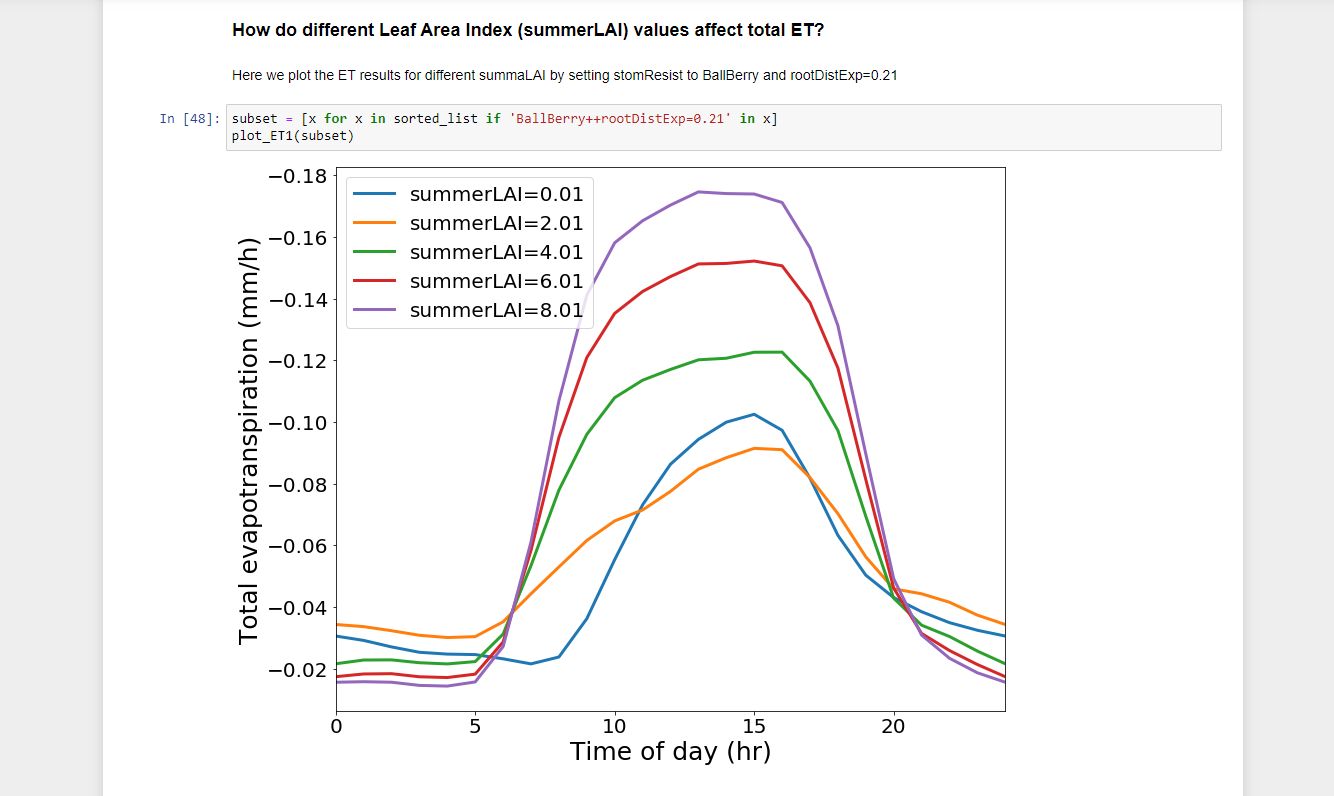
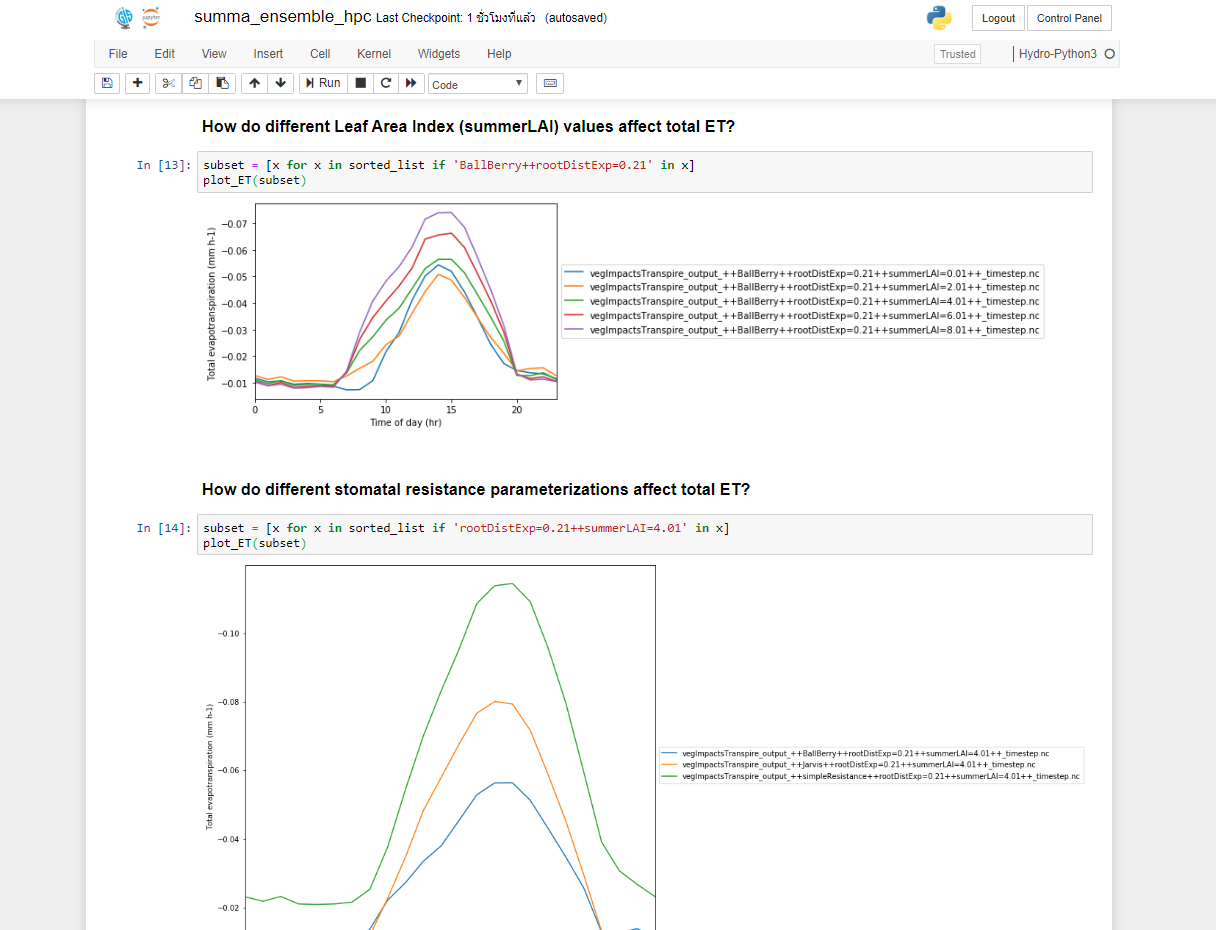
This notebook demonstrates how to harmonize different libraries and tools provided in the CyberGIS-Jupyter environment to run a 75-member ensemble SUMMA model with a High Performance Computer (HPC) resource. The SUMMA model instance and data used in this notebook were adapted from a part of the Clark et al., (2015) study, and explored the impact of different stomatal resistance parameterizations on total evapotranspiration (ET) in the Reynolds Mountain East catchment in southwestern Idaho.
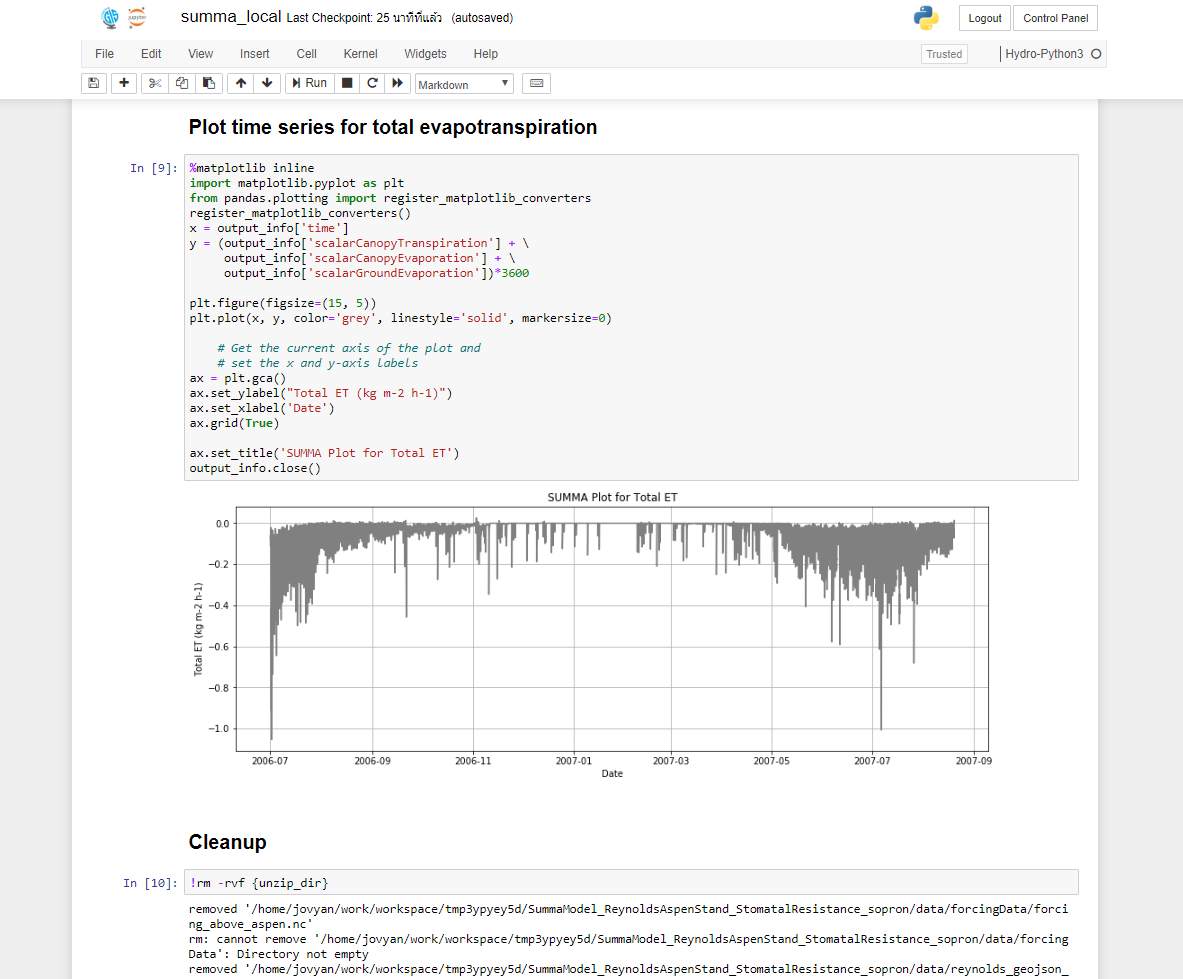
This notebook provides the option to allow users to run SUMMA model locally, which is suitable for development, debugging and proof of concept study at small scales. The SUMMA Model instance used is a part of the Clark et al., (2015) study, and explored the impact of different stomatal resistance parameterizations on total evapotranspiration (ET) in the Reynolds Mountain East catchment in southwestern Idaho.
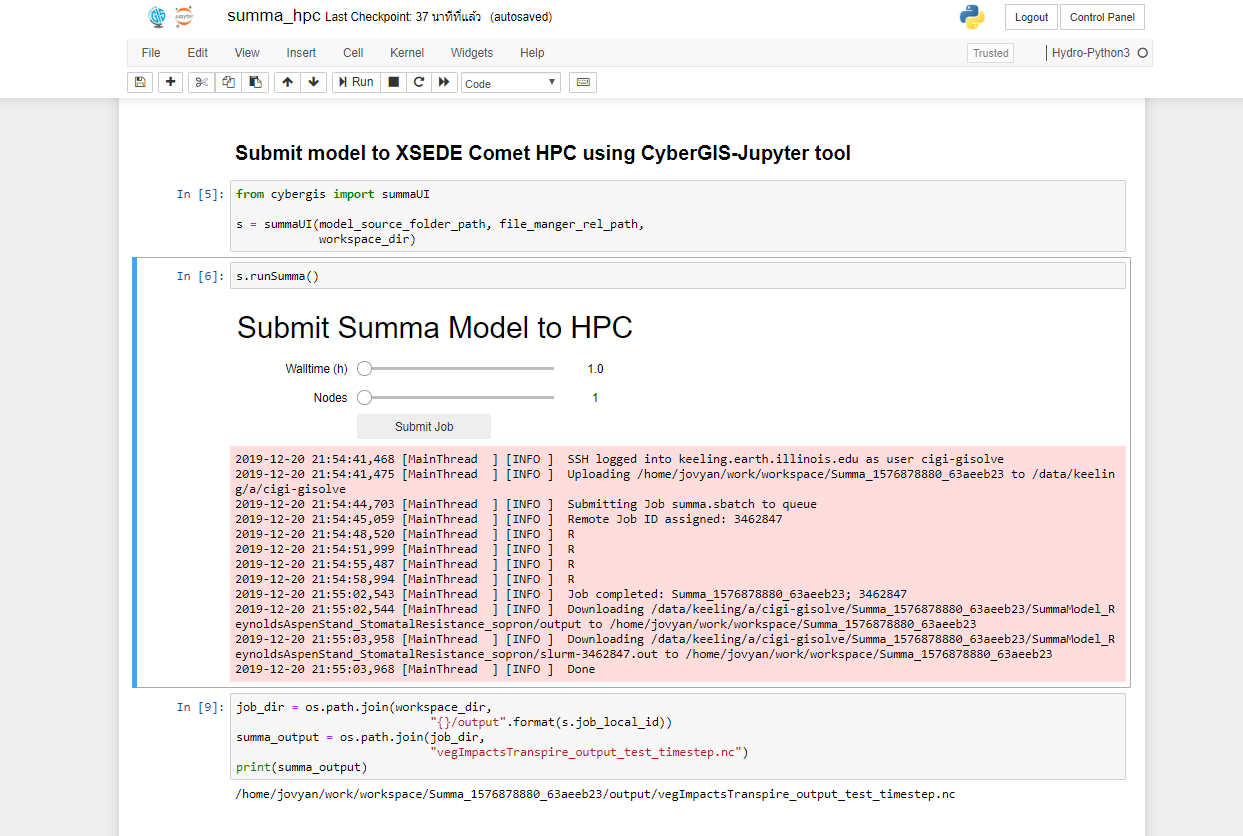
This notebook demonstrates how to harmonize different libraries and tools provided in the CyberGIS-Jupyter environment to run SUMMA model with a High Performance Computer (HPC) resource (Lyu 2019). The SUMMA Model instance used is a part of the Clark et al., (2015) study, and explored the impact of different stomatal resistance parameterizations on total evapotranspiration (ET) in the Reynolds Mountain East catchment in southwestern Idaho.
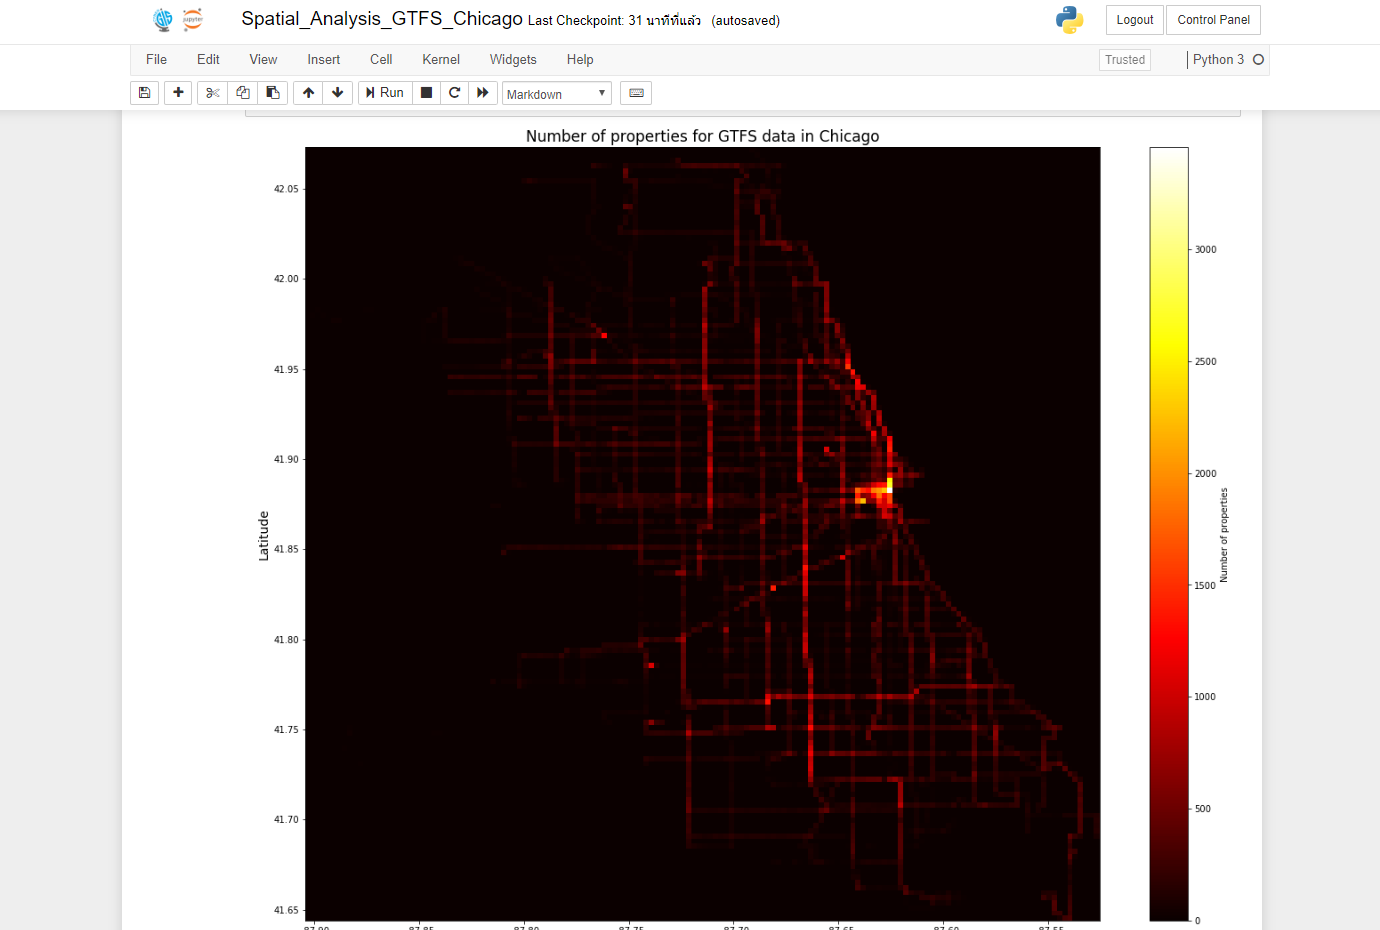
This demonstration shows the power of the datashader library to make geospatial visualizations of public transport data in Chicago. The osmnx is used to compute the edge bearings of the Chicago GTFS data, the distribution of bearings properties of Chicago GTFS shows grid pattern in histogram distribution plotting and polar plotting.
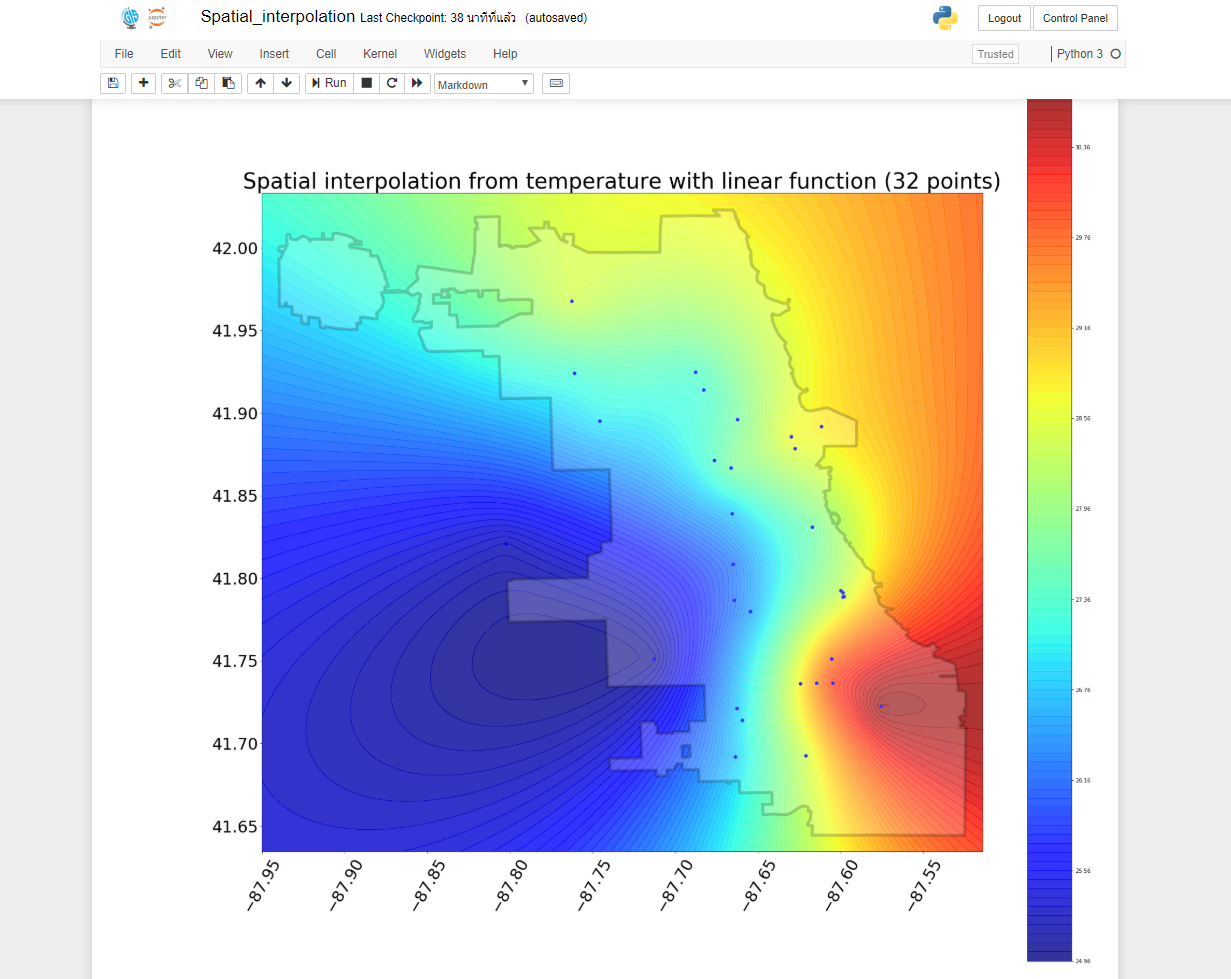
Spatial interpolation is used to predicts values for cells in a raster from a limited number of sample data points around it. We are studying streaming high-frequency temperature data in Chicago retrieved from Array of Thing (AoT). Kriging is a family of estimators used to interpolate spatial data. This family includes ordinary kriging, universal kriging, indicator kriging, co-kriging, and others (Taken from Lefohn et al., 2005). The choice of which kriging to use depends on the characteristics of the data and the type of spatial model desired. The most commonly used method is ordinary kriging, which was selected for this study.
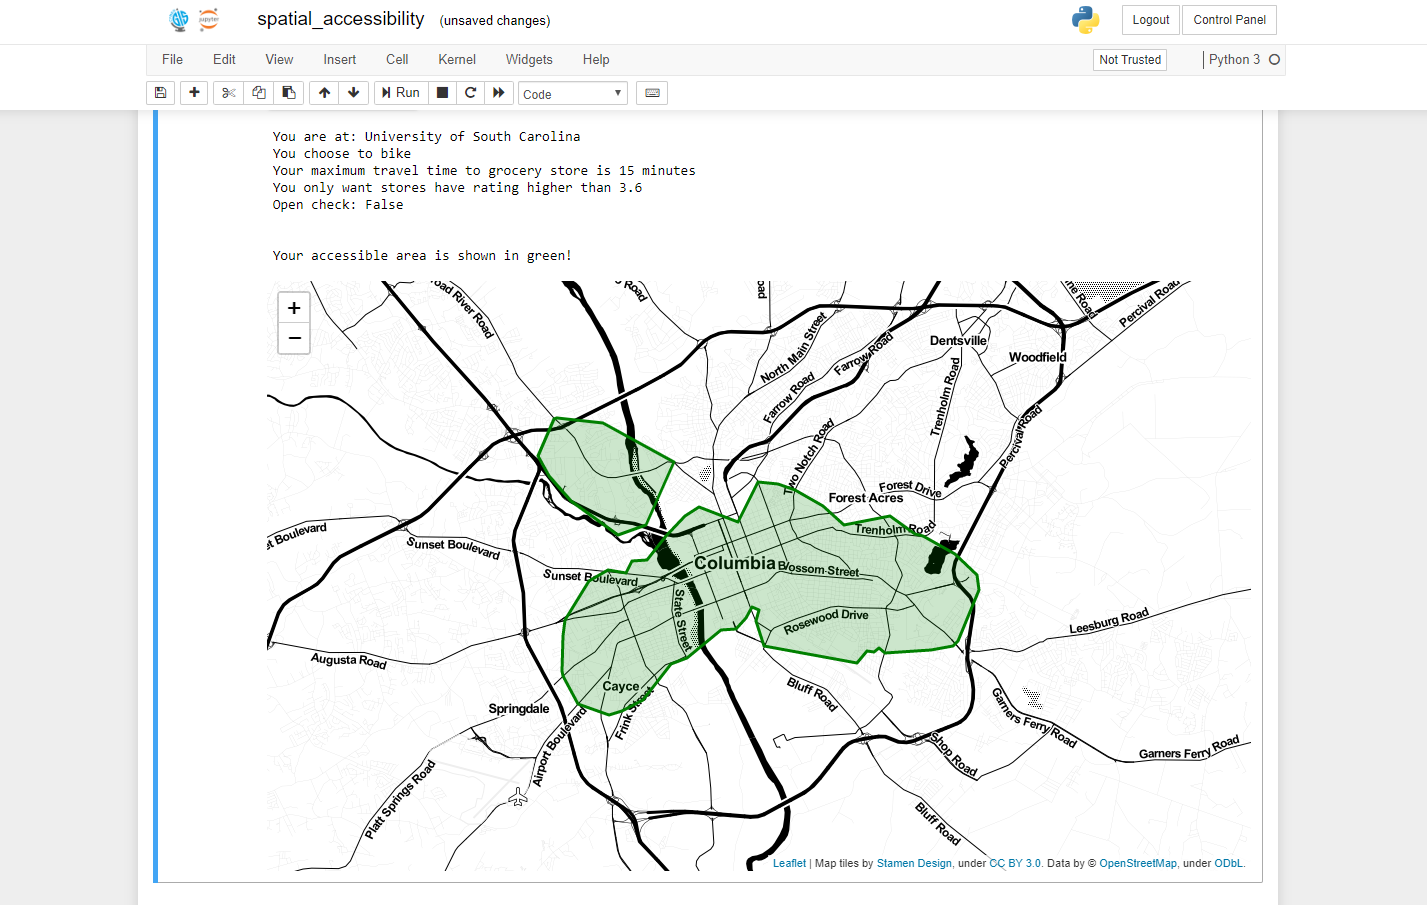
This notebook demonstrates a study on food accessibility addressing two research questions: 1) what is the service area of particular grocery stores? and 2) what impact do individual user preferences have on accessible food service areas?
© CyberGIS Center