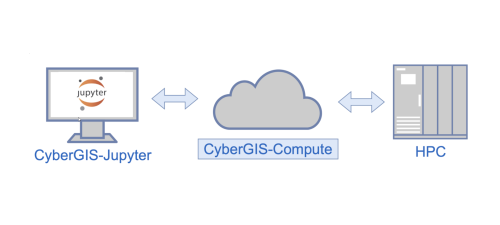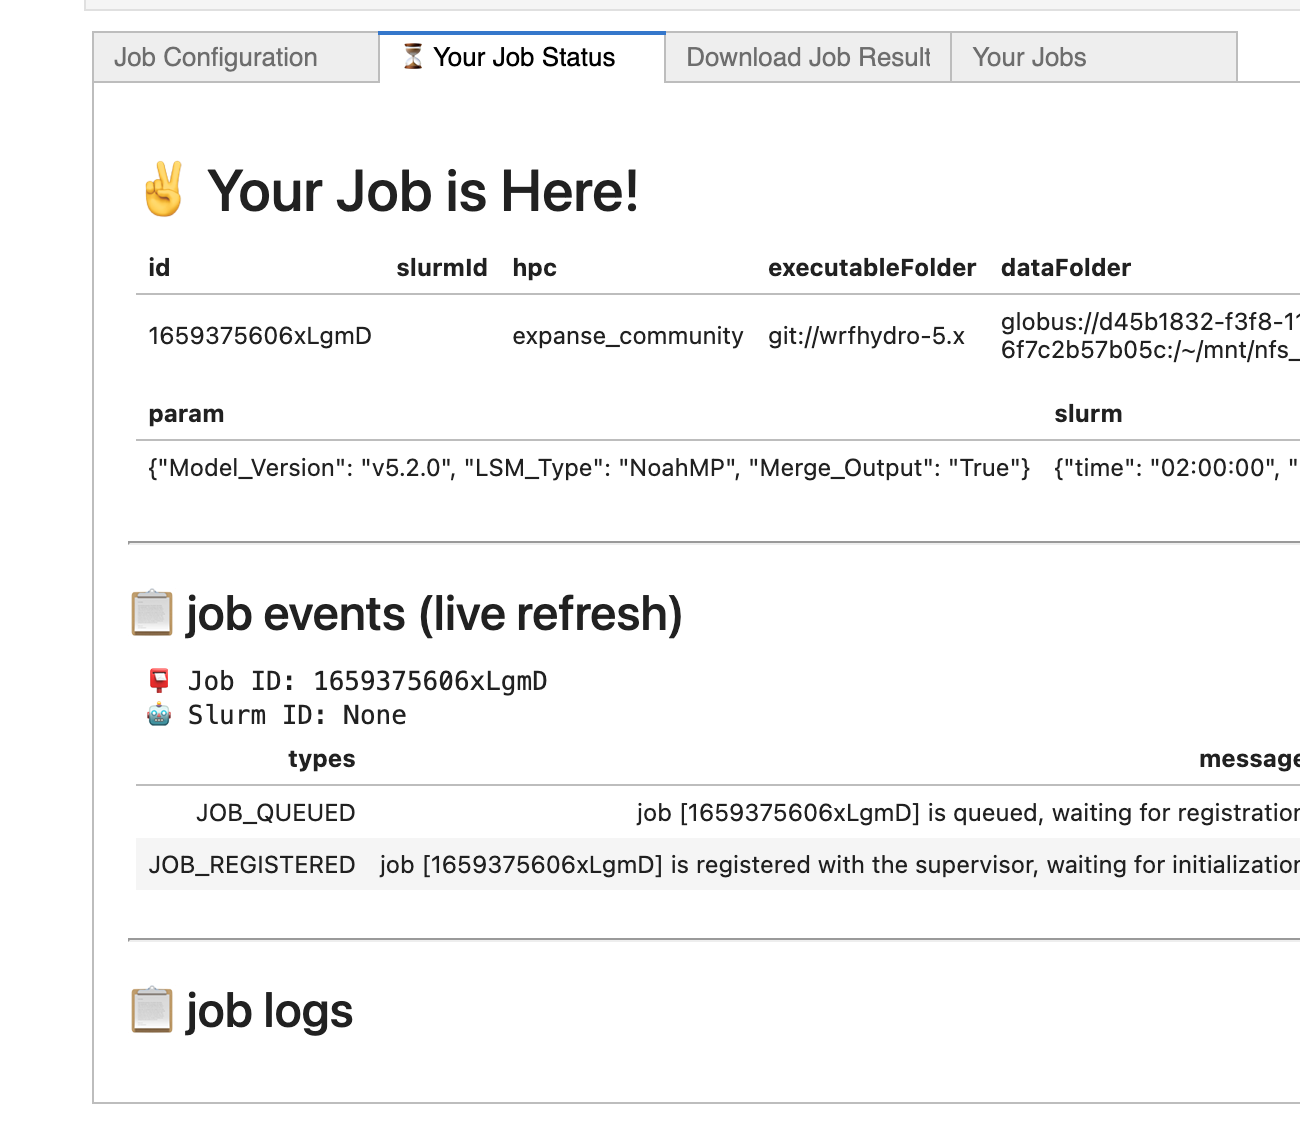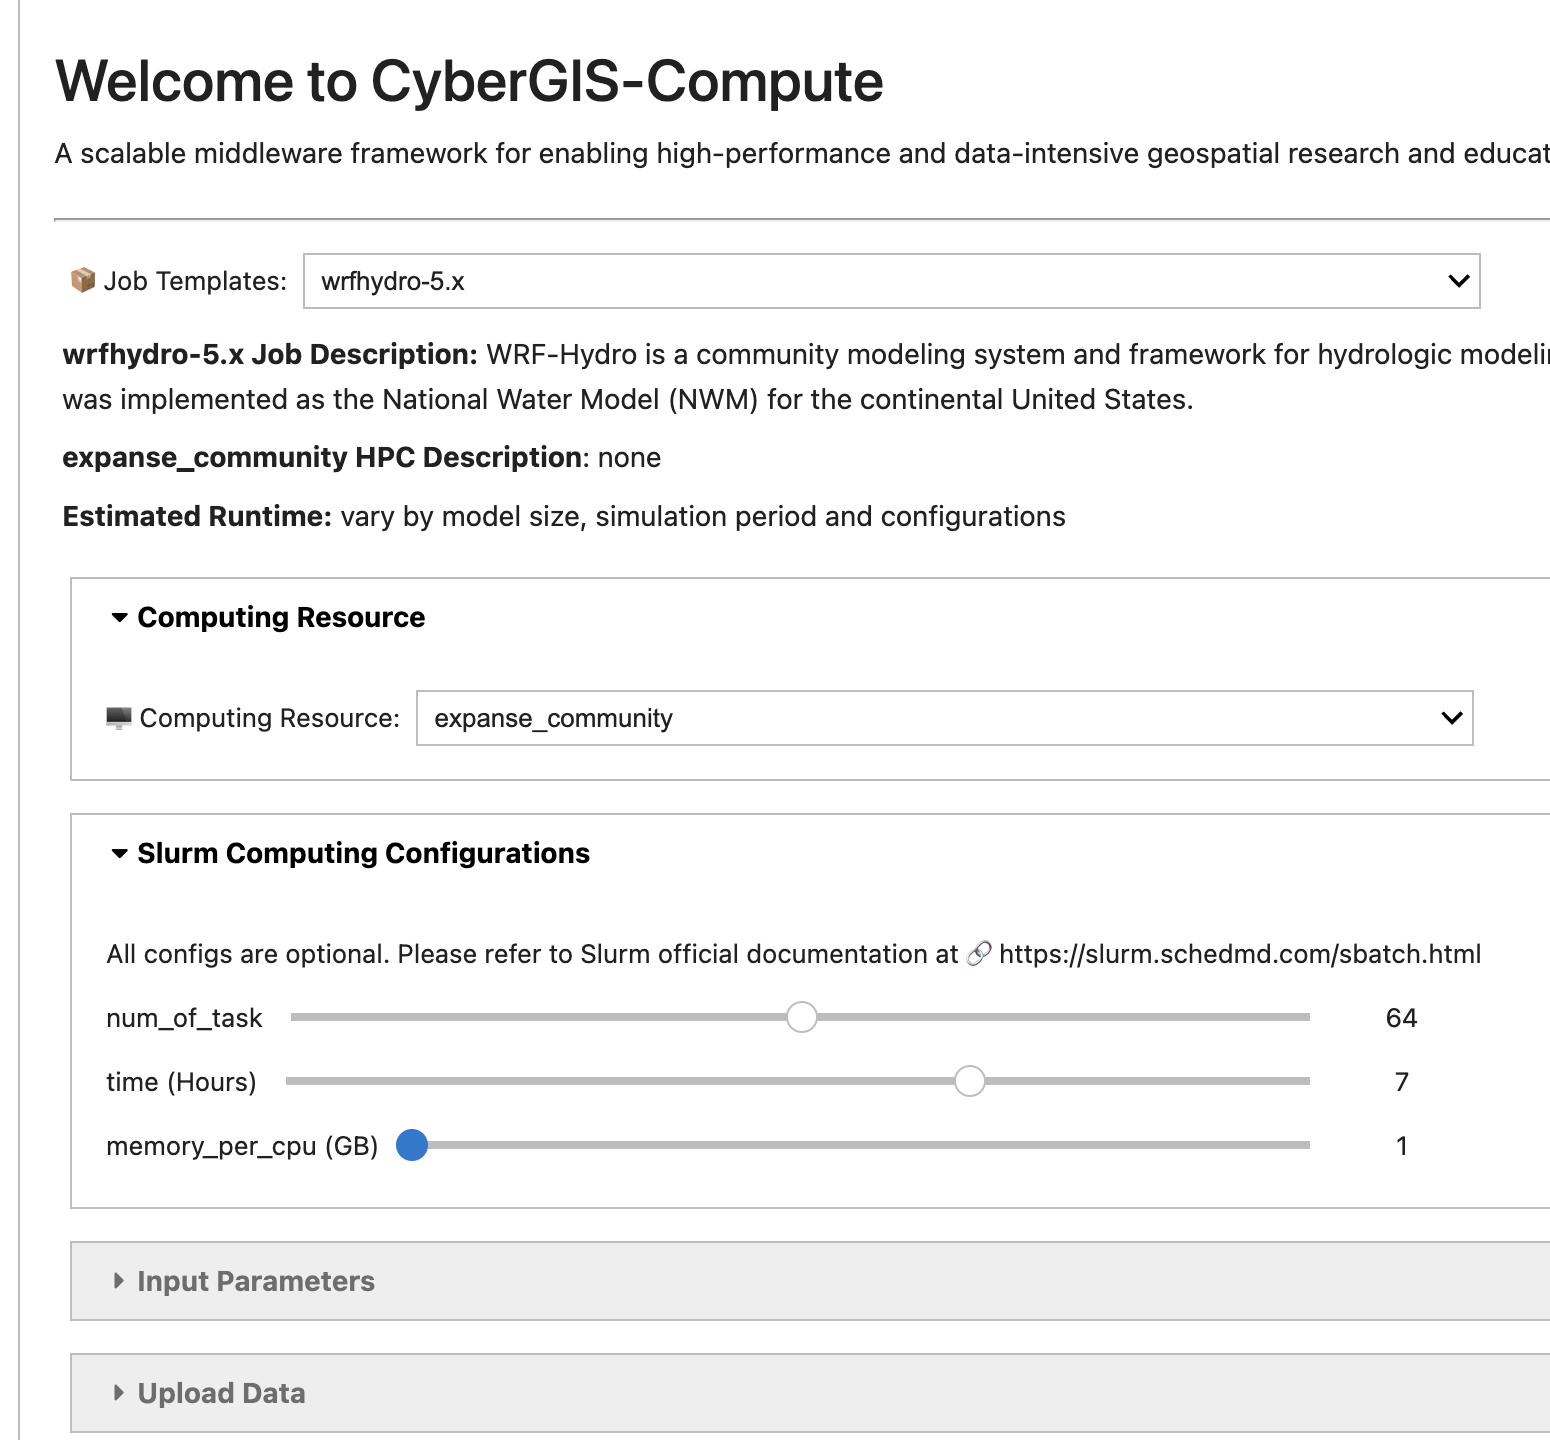
CyberGIS-Compute is an open-source geospatial middleware framework that provides seamless access to high-performance computing (HPC) resources through a Python-based SDK and a suite of core services. The key features of CyberGIS-Compute are highlighted as follows.
Software repository:
Help page: https://cybergis.github.io/cybergis-compute-python-sdk/index.html
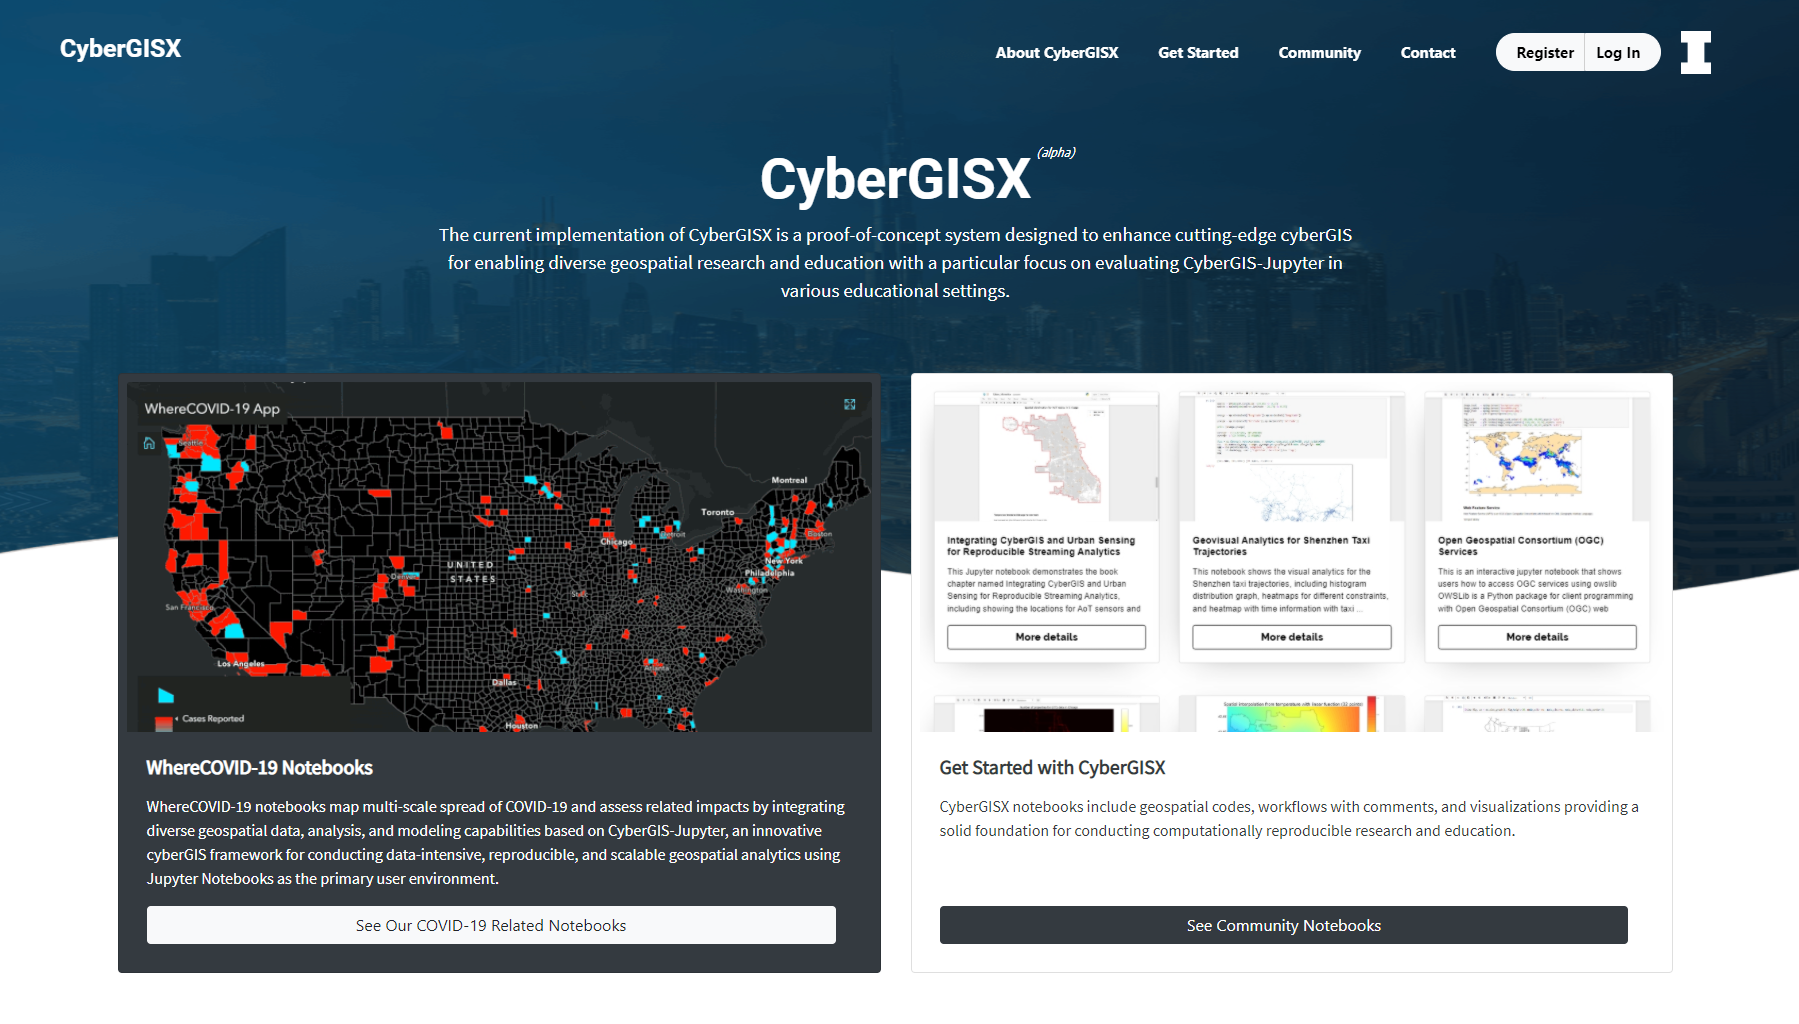
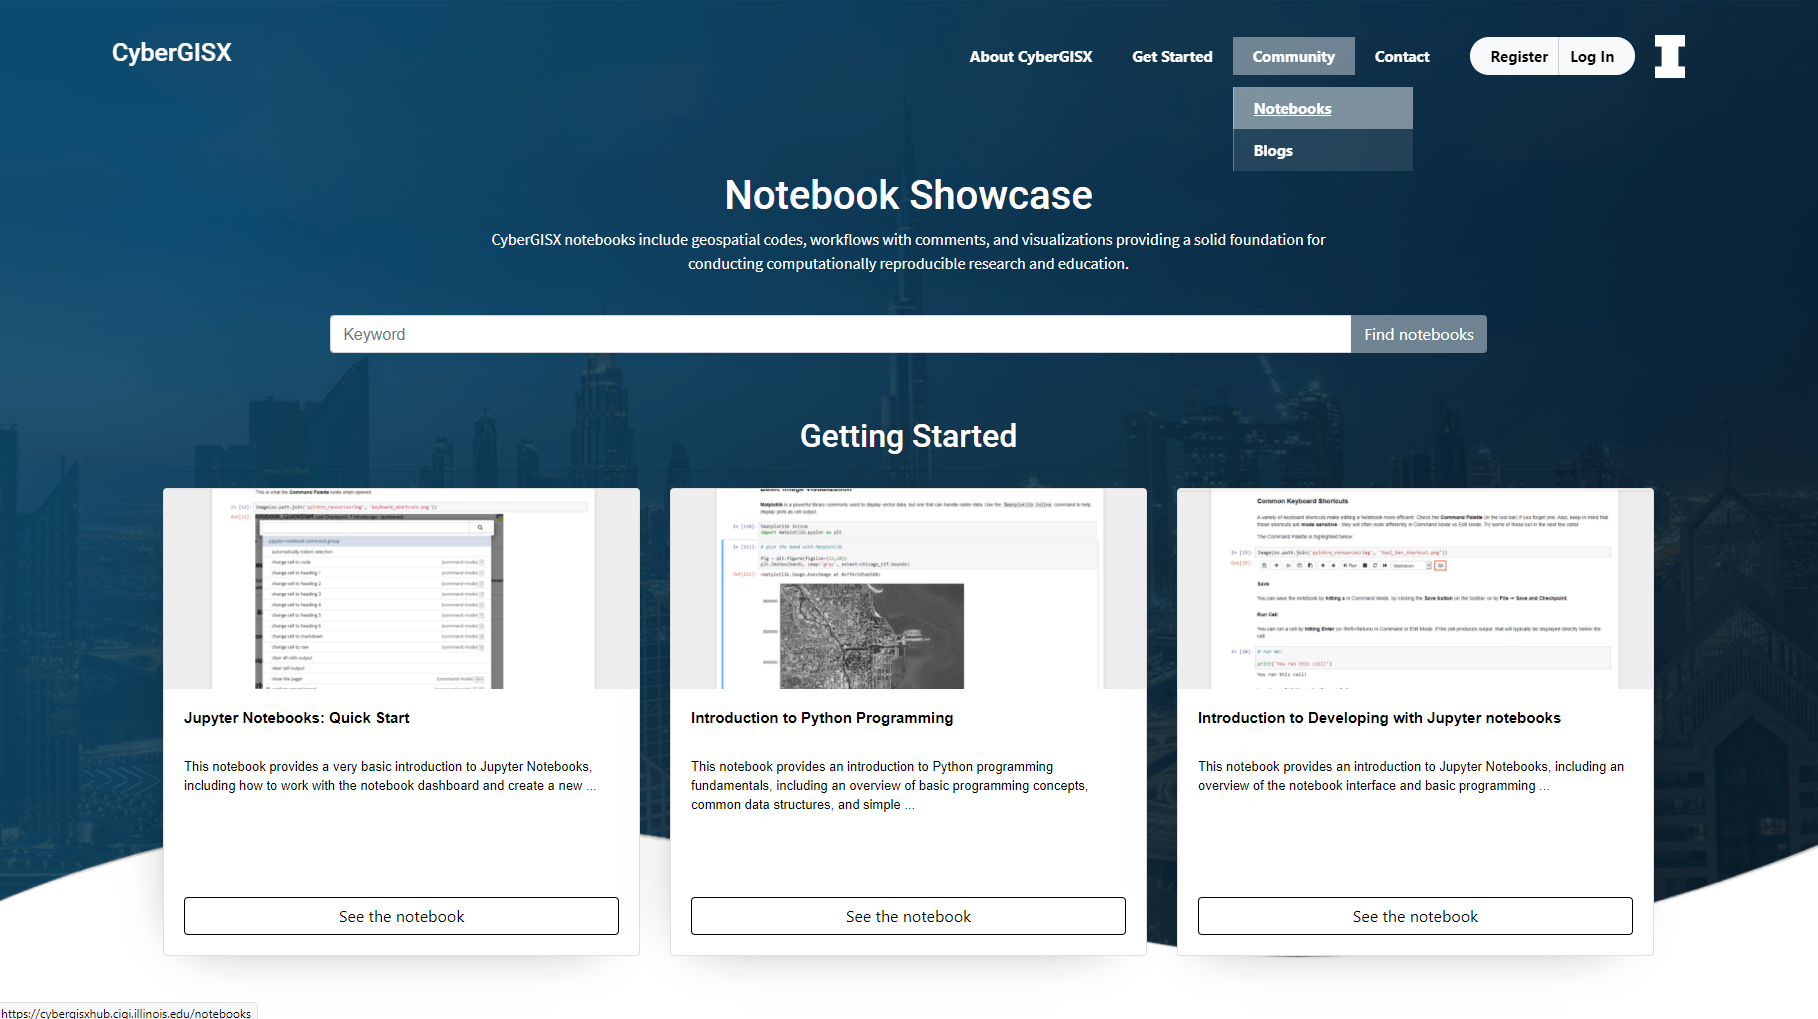
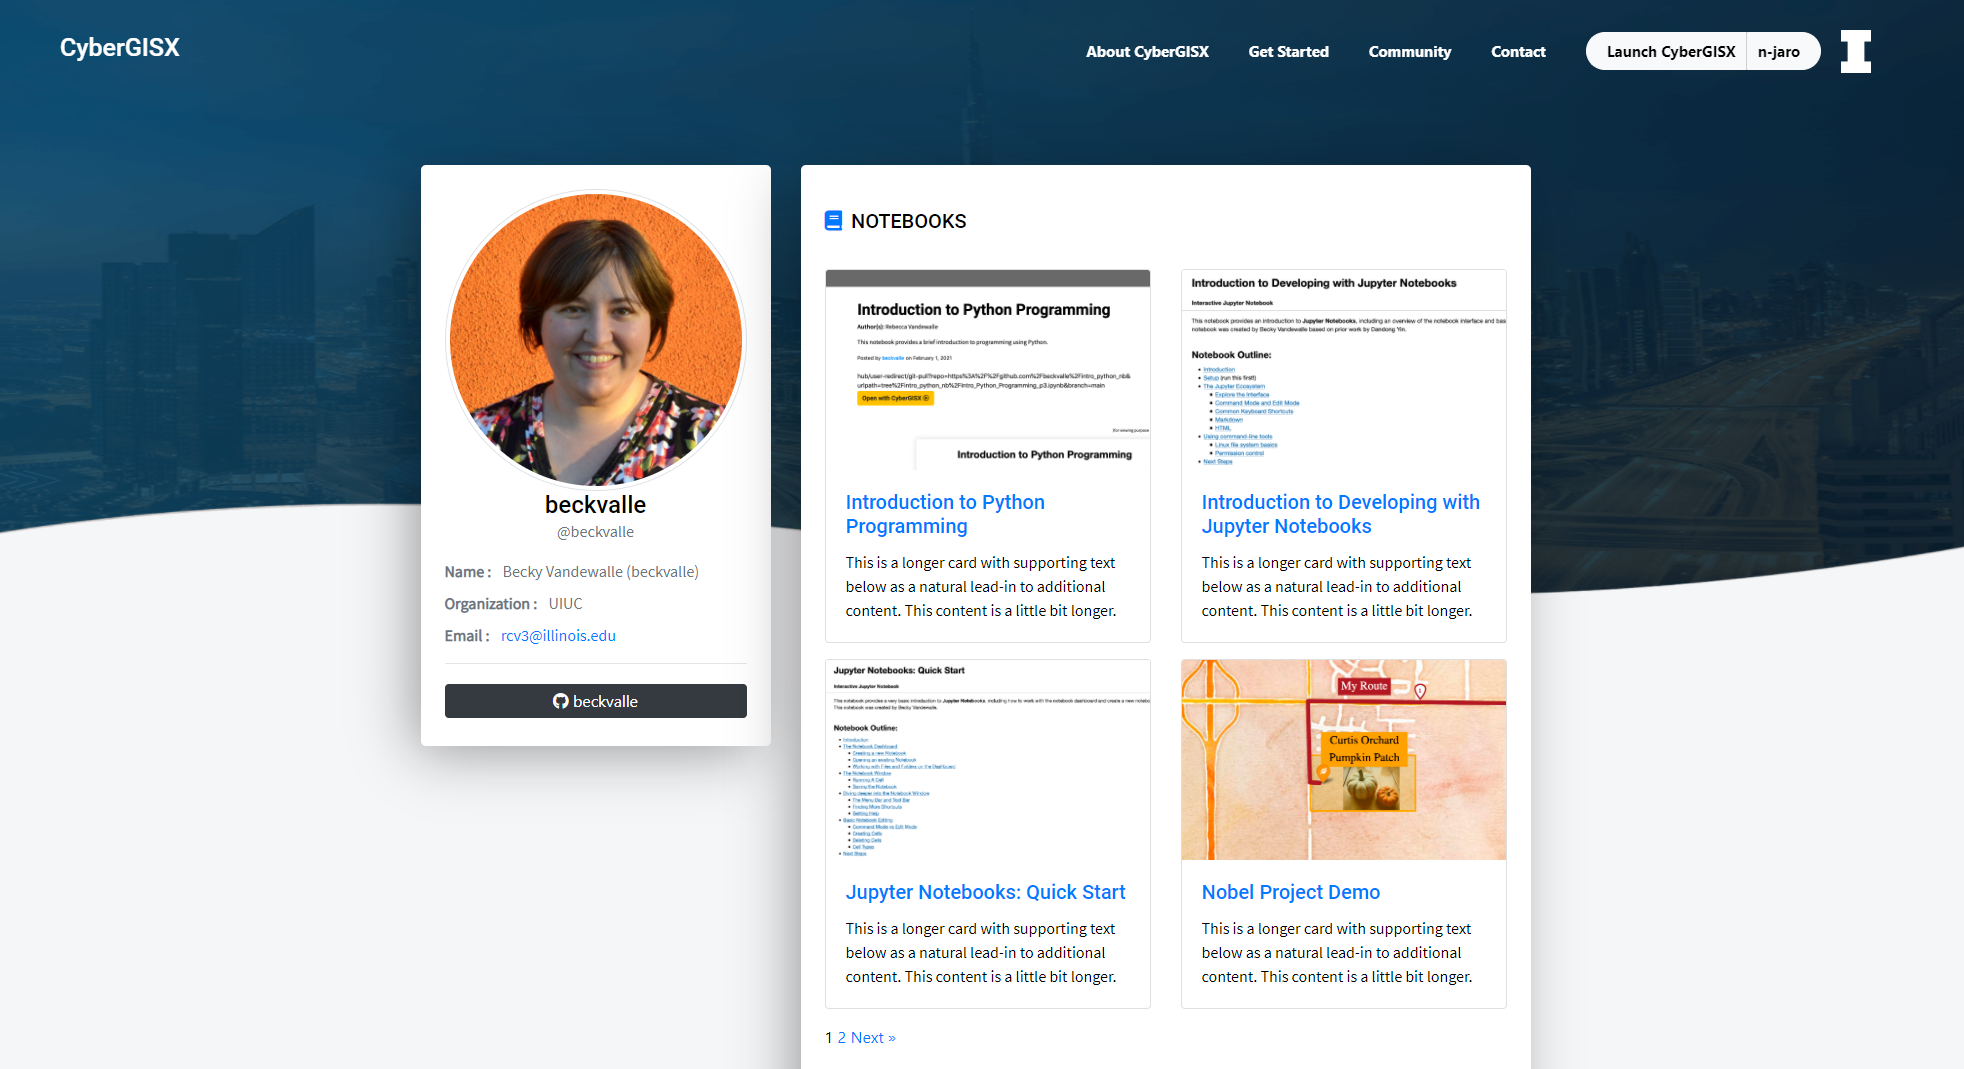
The CyberGISX platform supports data-intensive, reproducible, and scalable geospatial analytics, modeling, and simulation. The platform integrates cyberGIS capabilities with Jupyter Notebook to accelerate cyberGIS application development while encapsulating associated data, analytics, and workflows into application packages that can be reproduced through cutting-edge high-performance, data-intensive and cloud computing approaches.
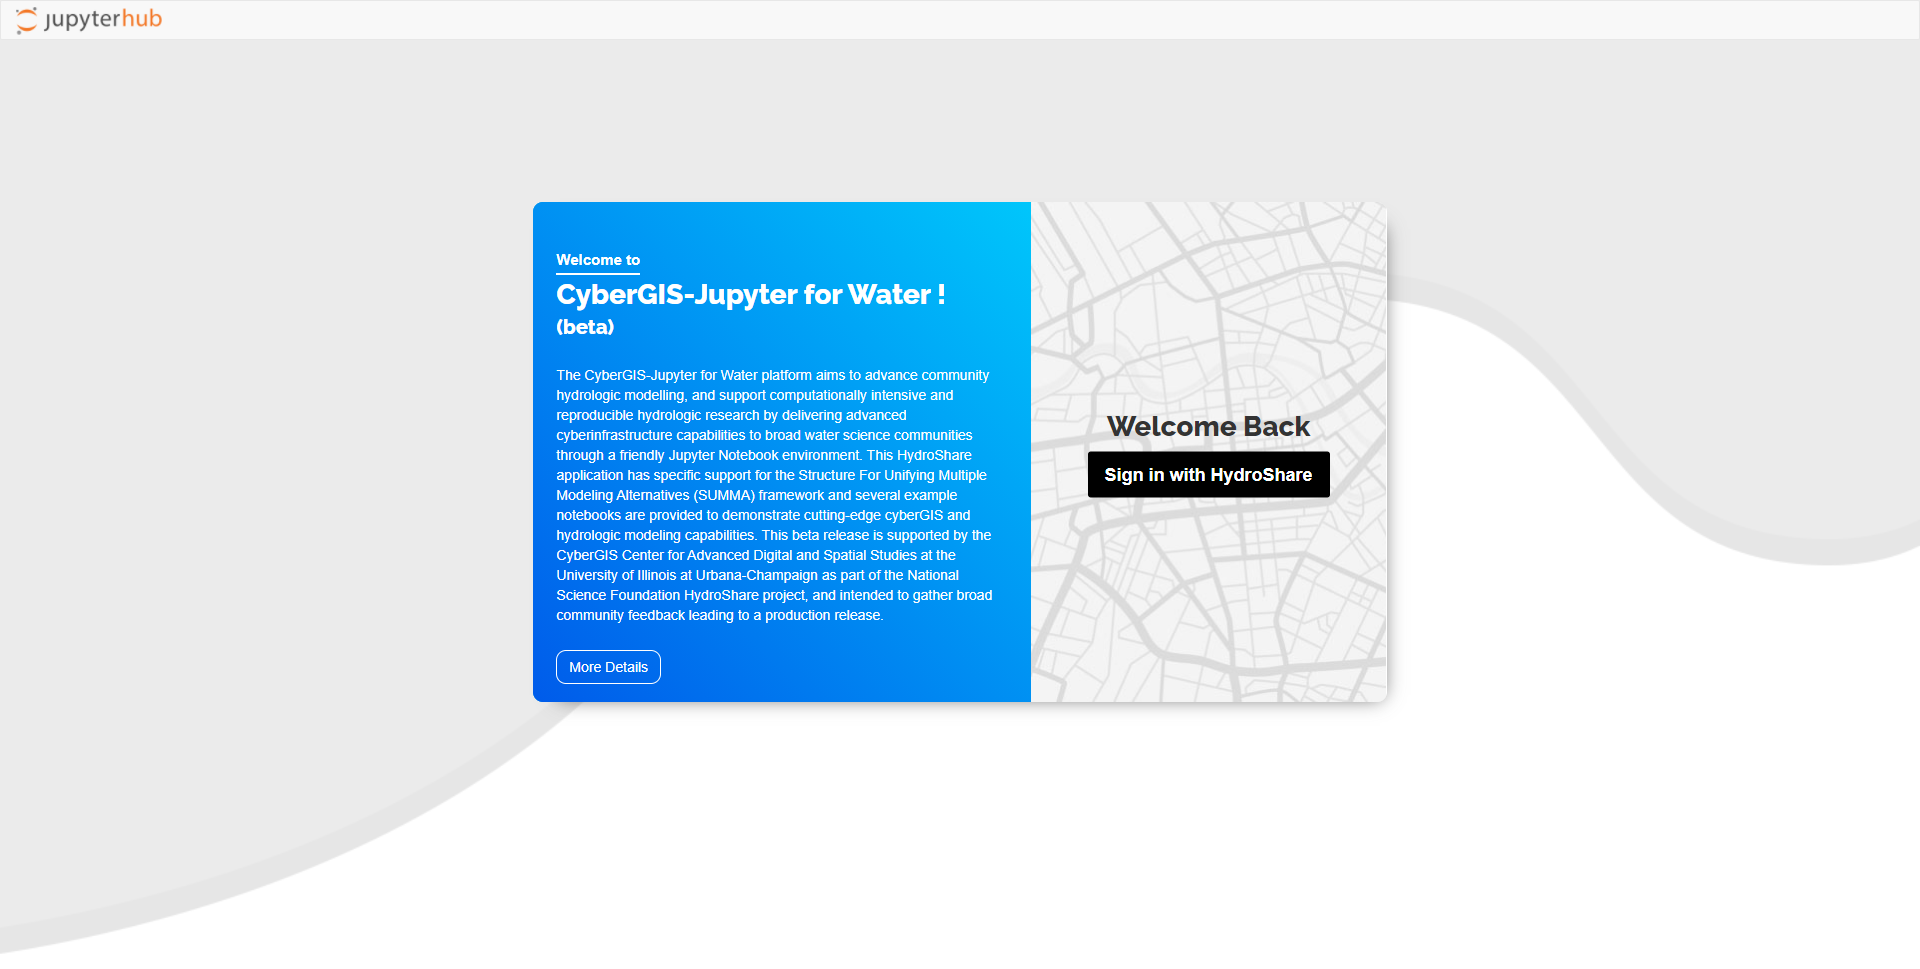
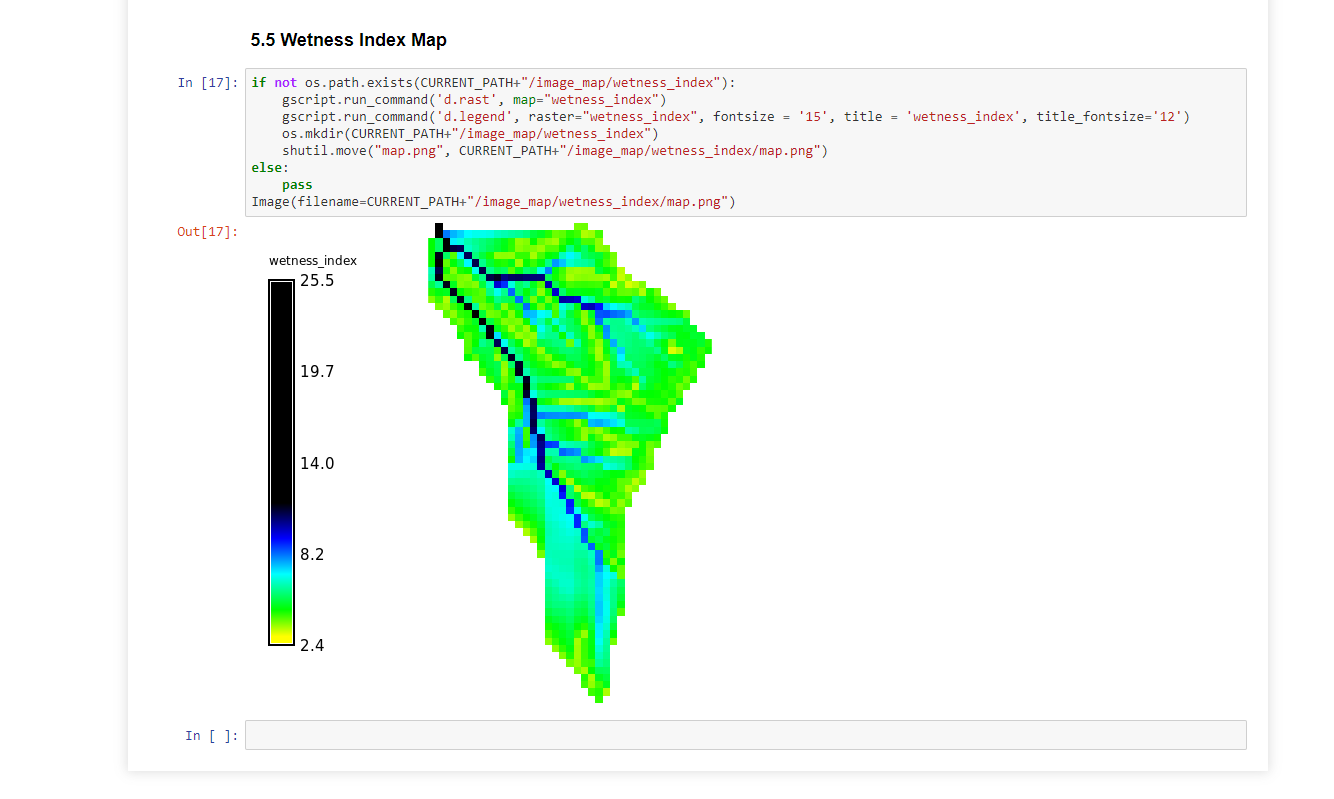
The CyberGIS-Jupyter for Water (CJW) platform aims to advance community hydrologic modeling, and support data-intensive, reproducible, and computationally scalable water science research by simplifying access to advanced cyberGIS and cyberinfrastructure capabilities through a friendly Jupyter Notebook environment. The platform allows models such as Structure For Unifying Multiple Modeling Alternatives (SUMMA) andWRFHydro to access high-performance computing resources through the CyberGIS Computing Service. CJW has been seamlessly integrated with the HydroShare ecosystem to enable easy access and use by the Hydrology community.
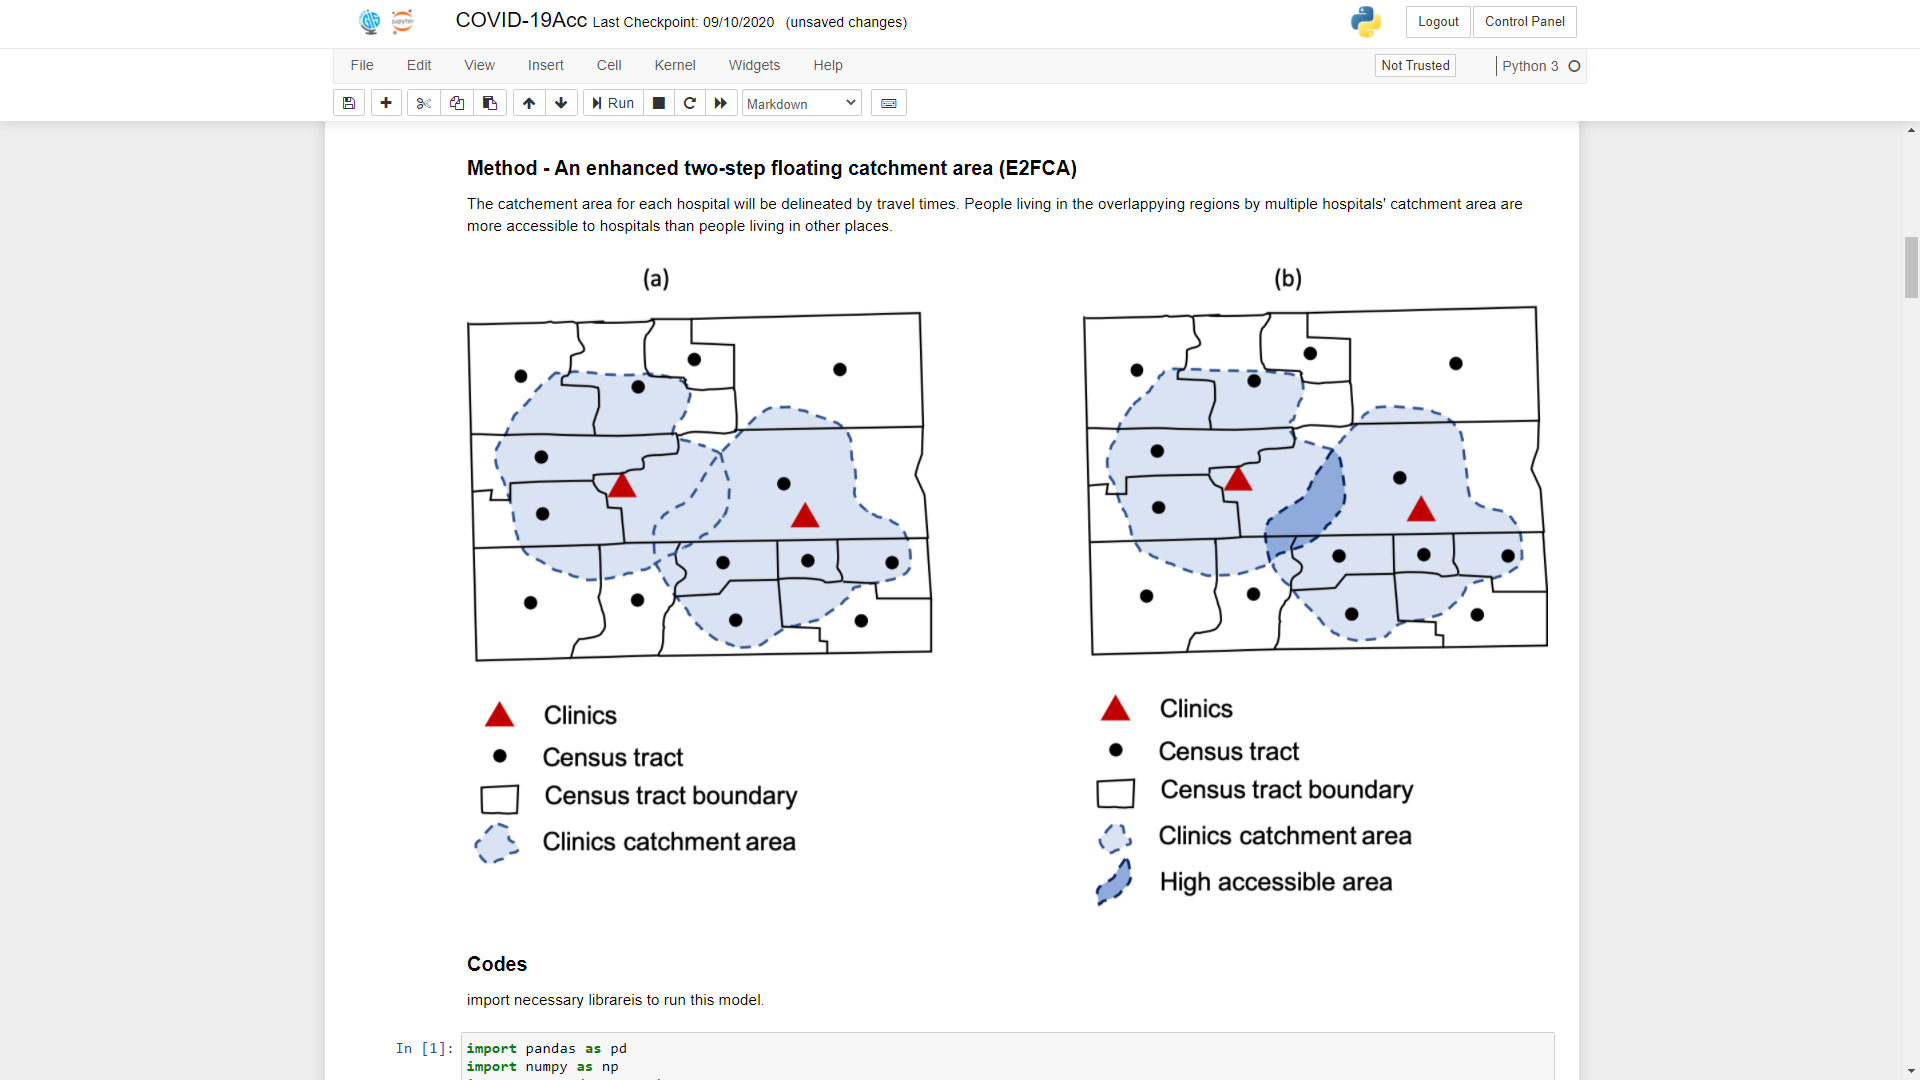
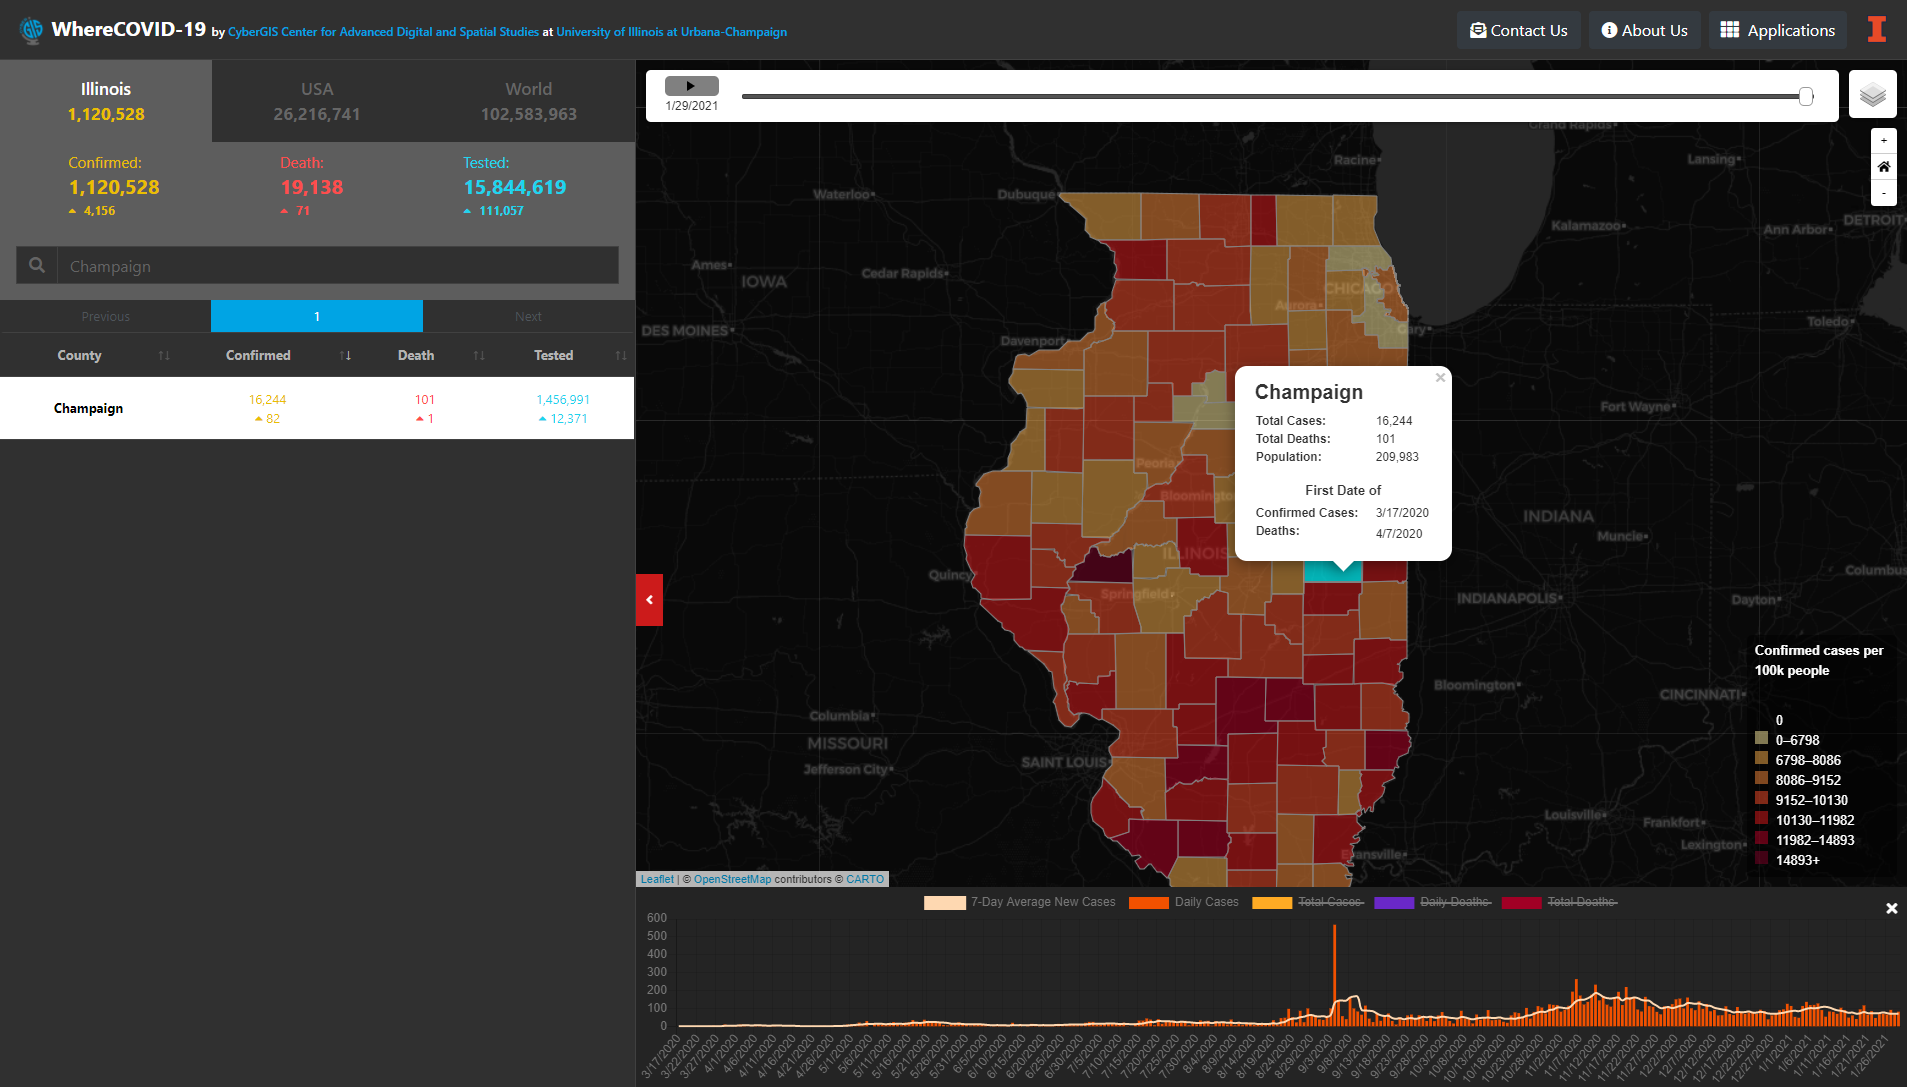
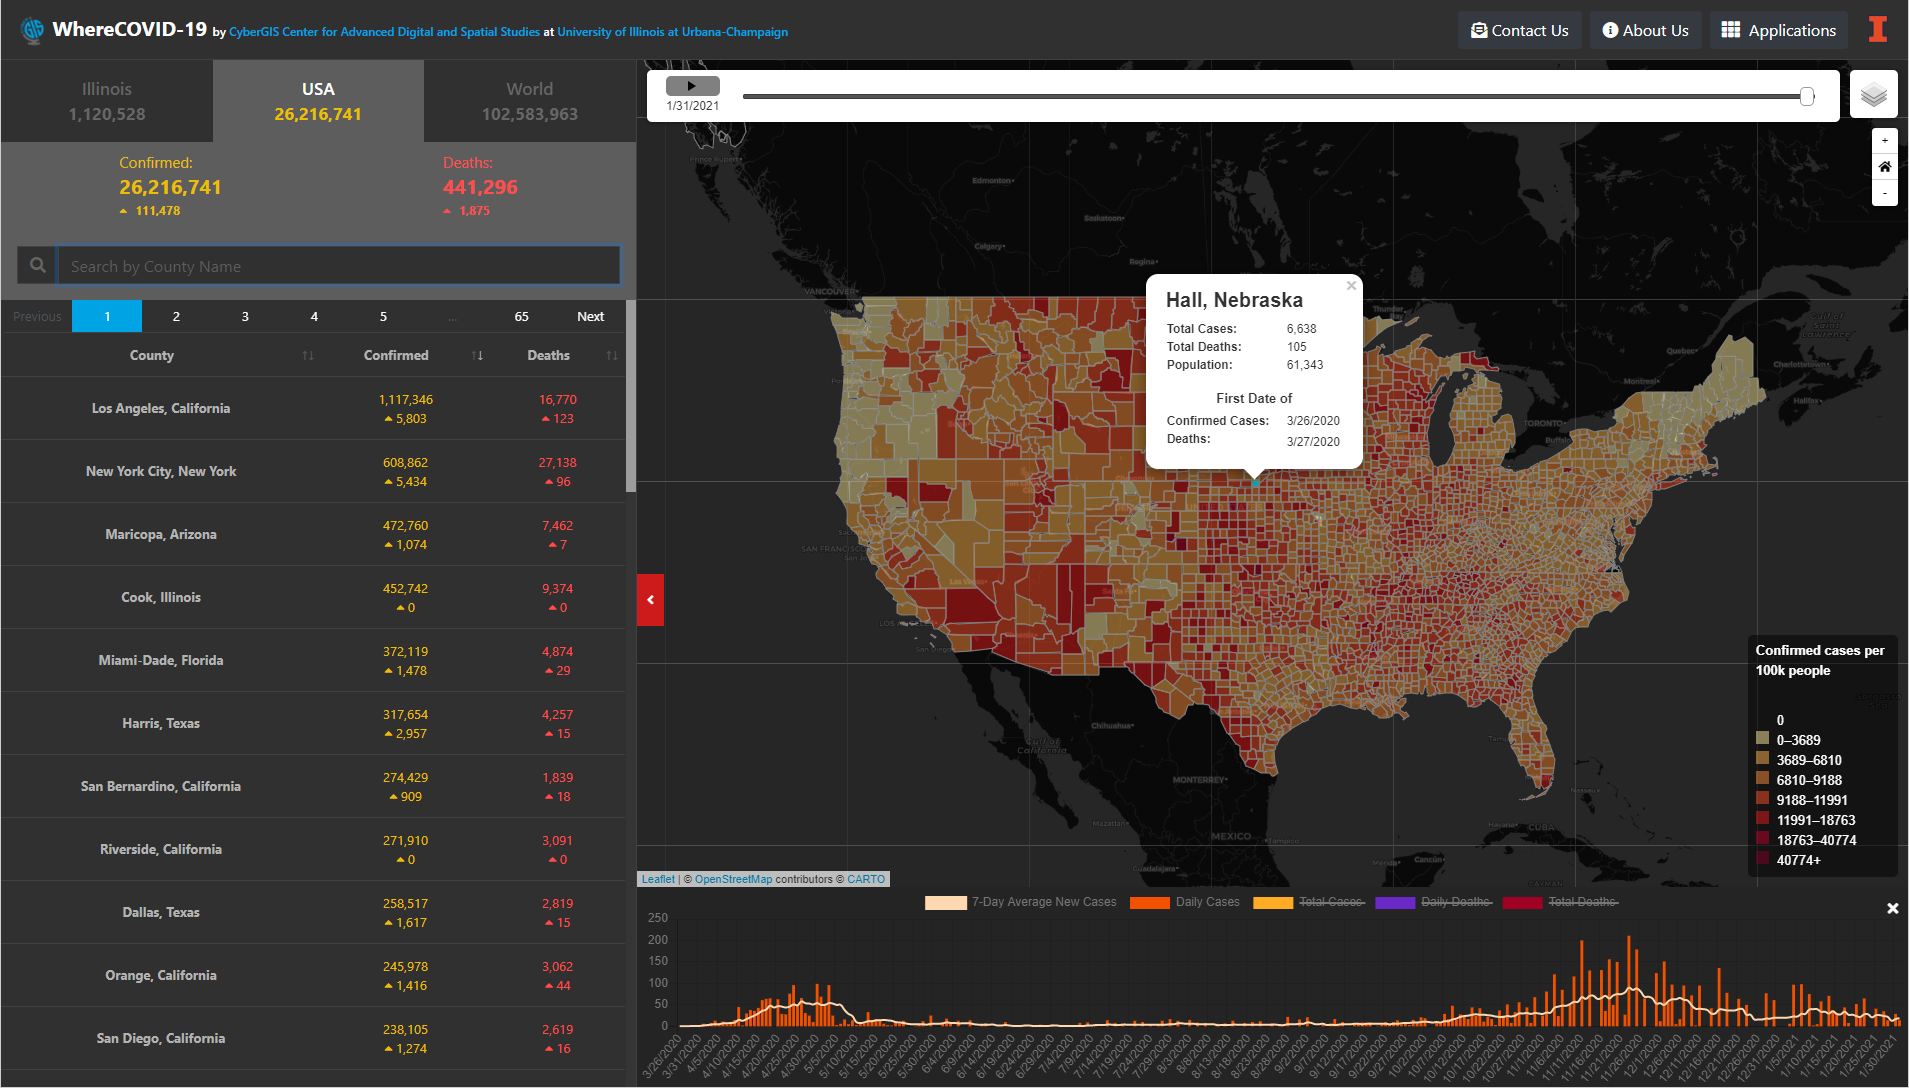
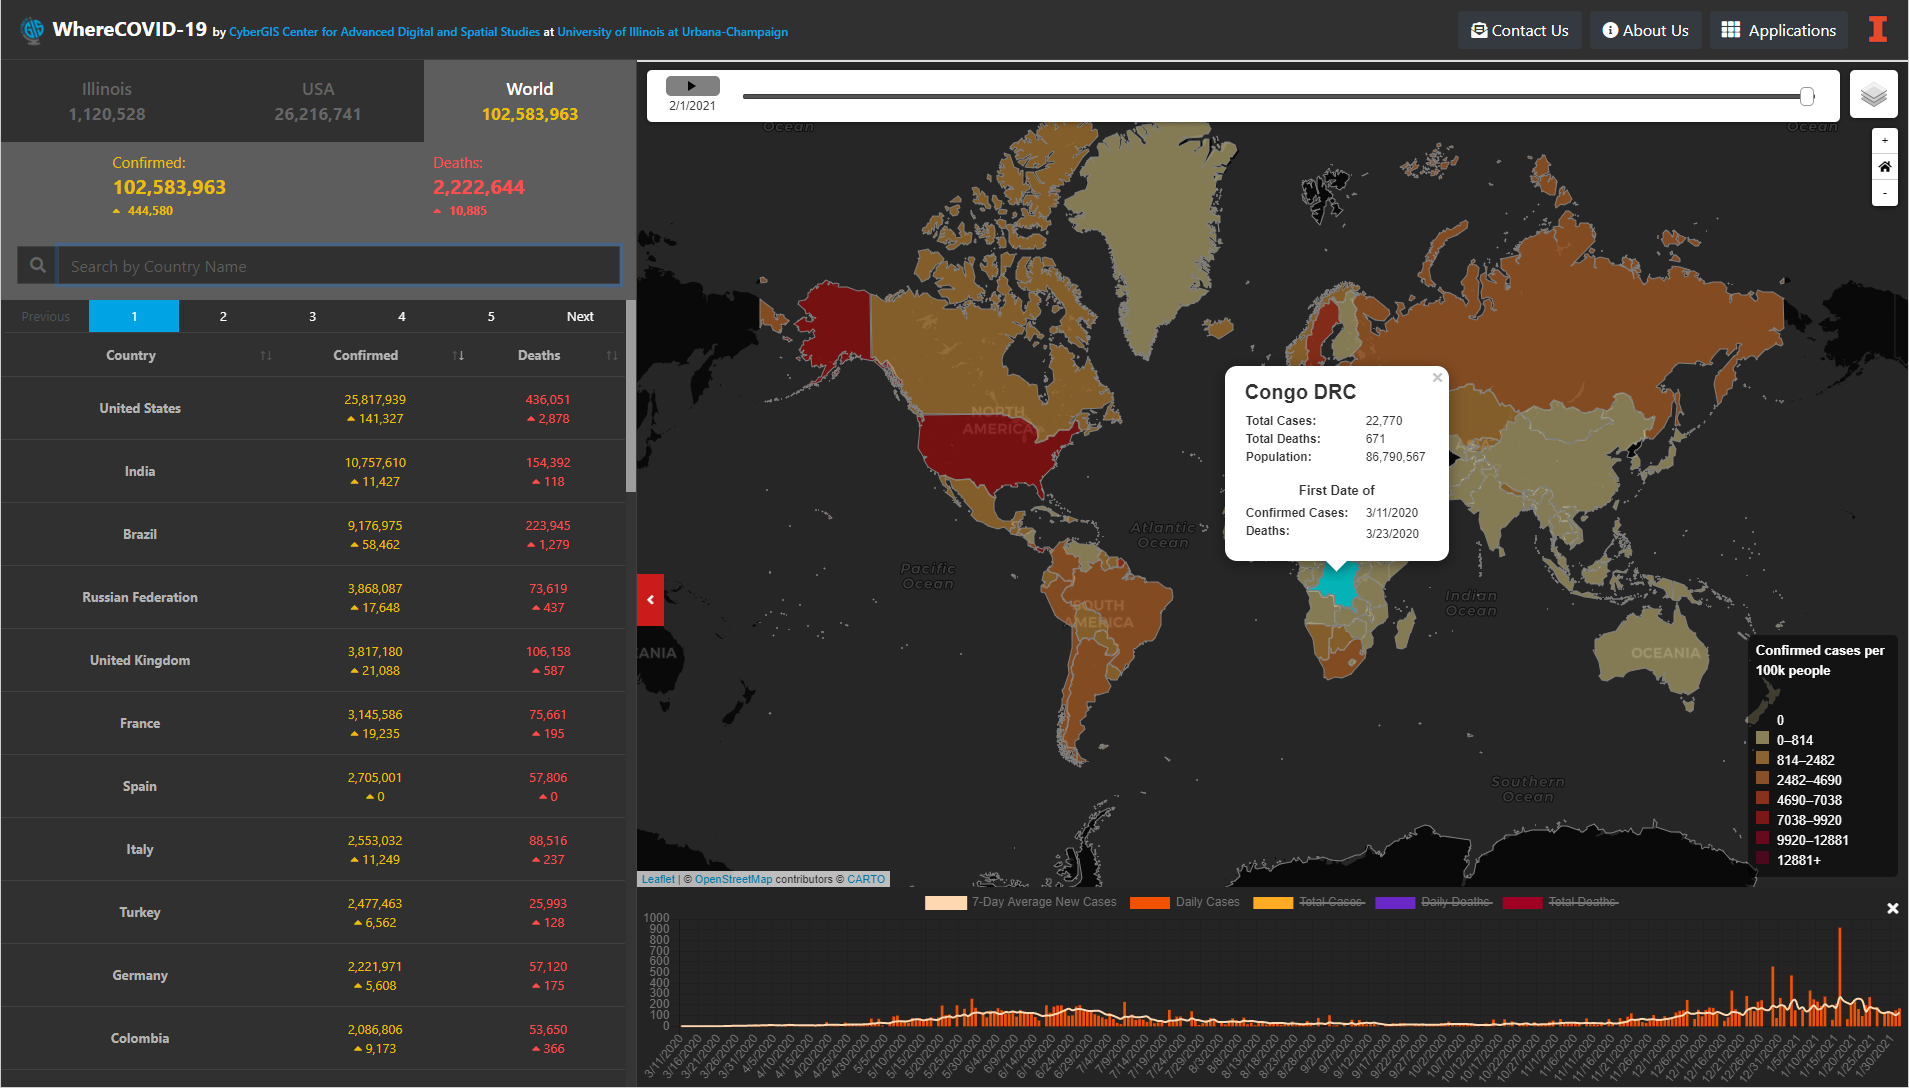
The WhereCOVID-19 platform maps and predicts where COVID-19 spreads across a number of spatial and temporal scales while providing an online spatial decision support system for identifying populations at risk and targeting health care interventions. The platform, developed collaboratively with epidemiology researchers and public health officials, provides a one-stop geospatial data and analysis system to support cutting-edge research and timely decision-making.
URL: https://wherecovid19.cigi.illinois.edu/
Source code: https://github.com/cybergis/wherecovid19_webapp
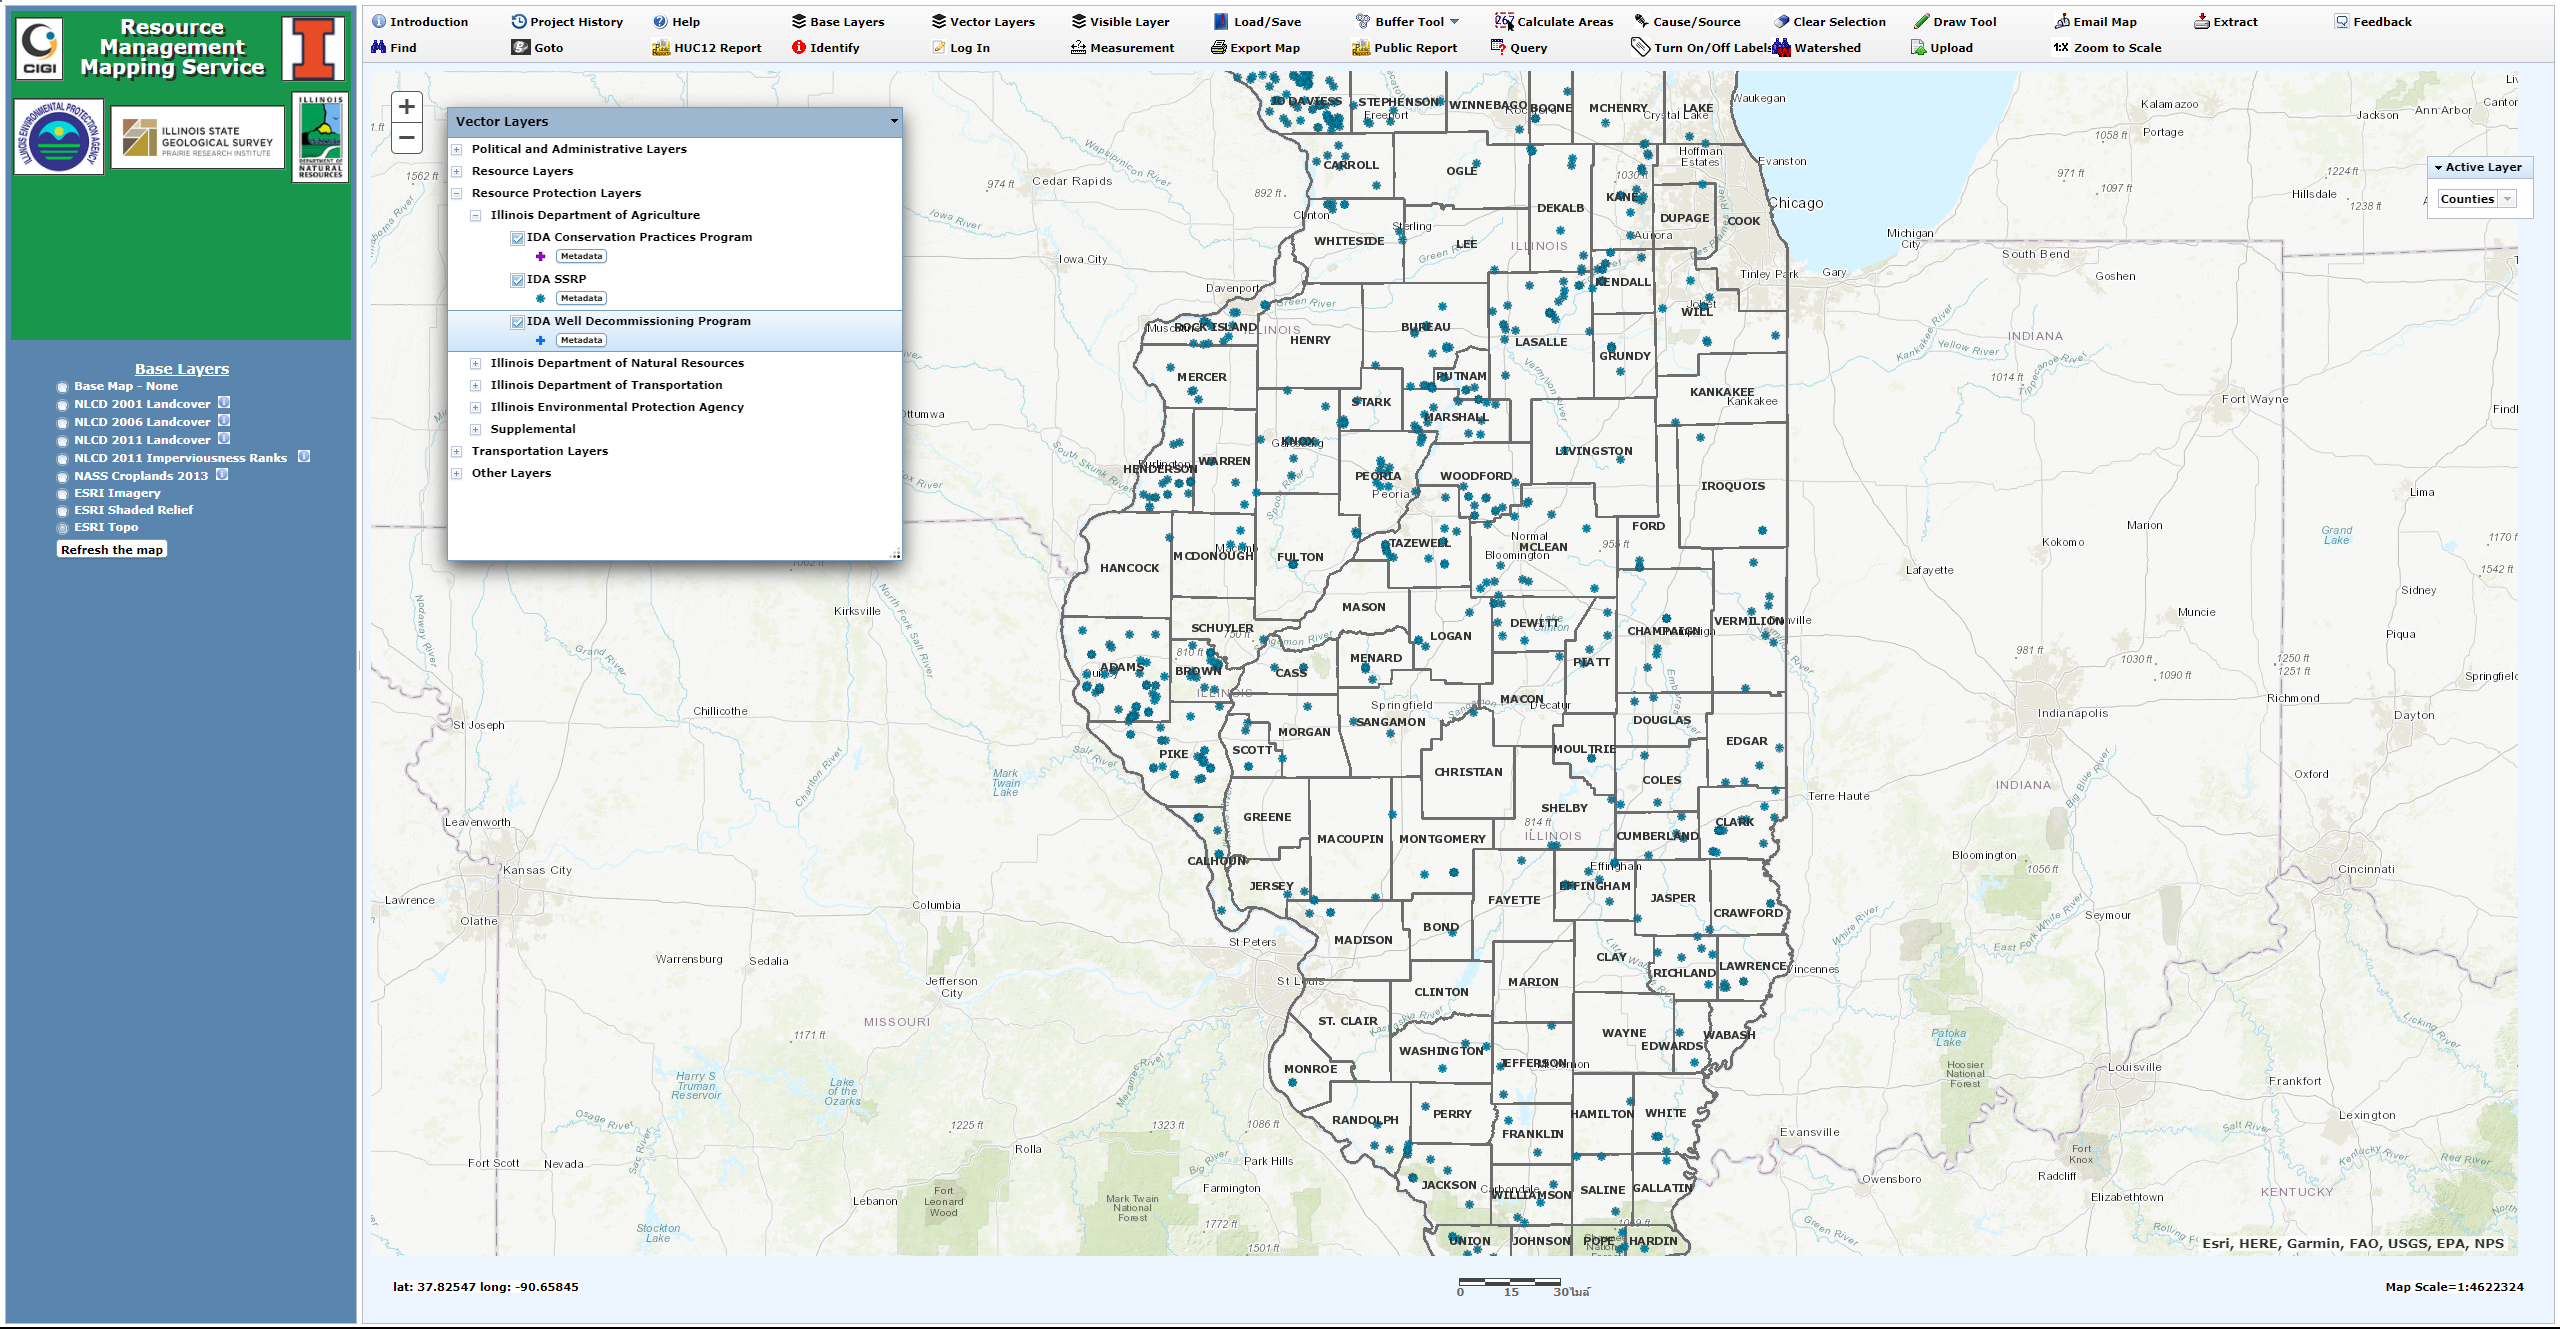
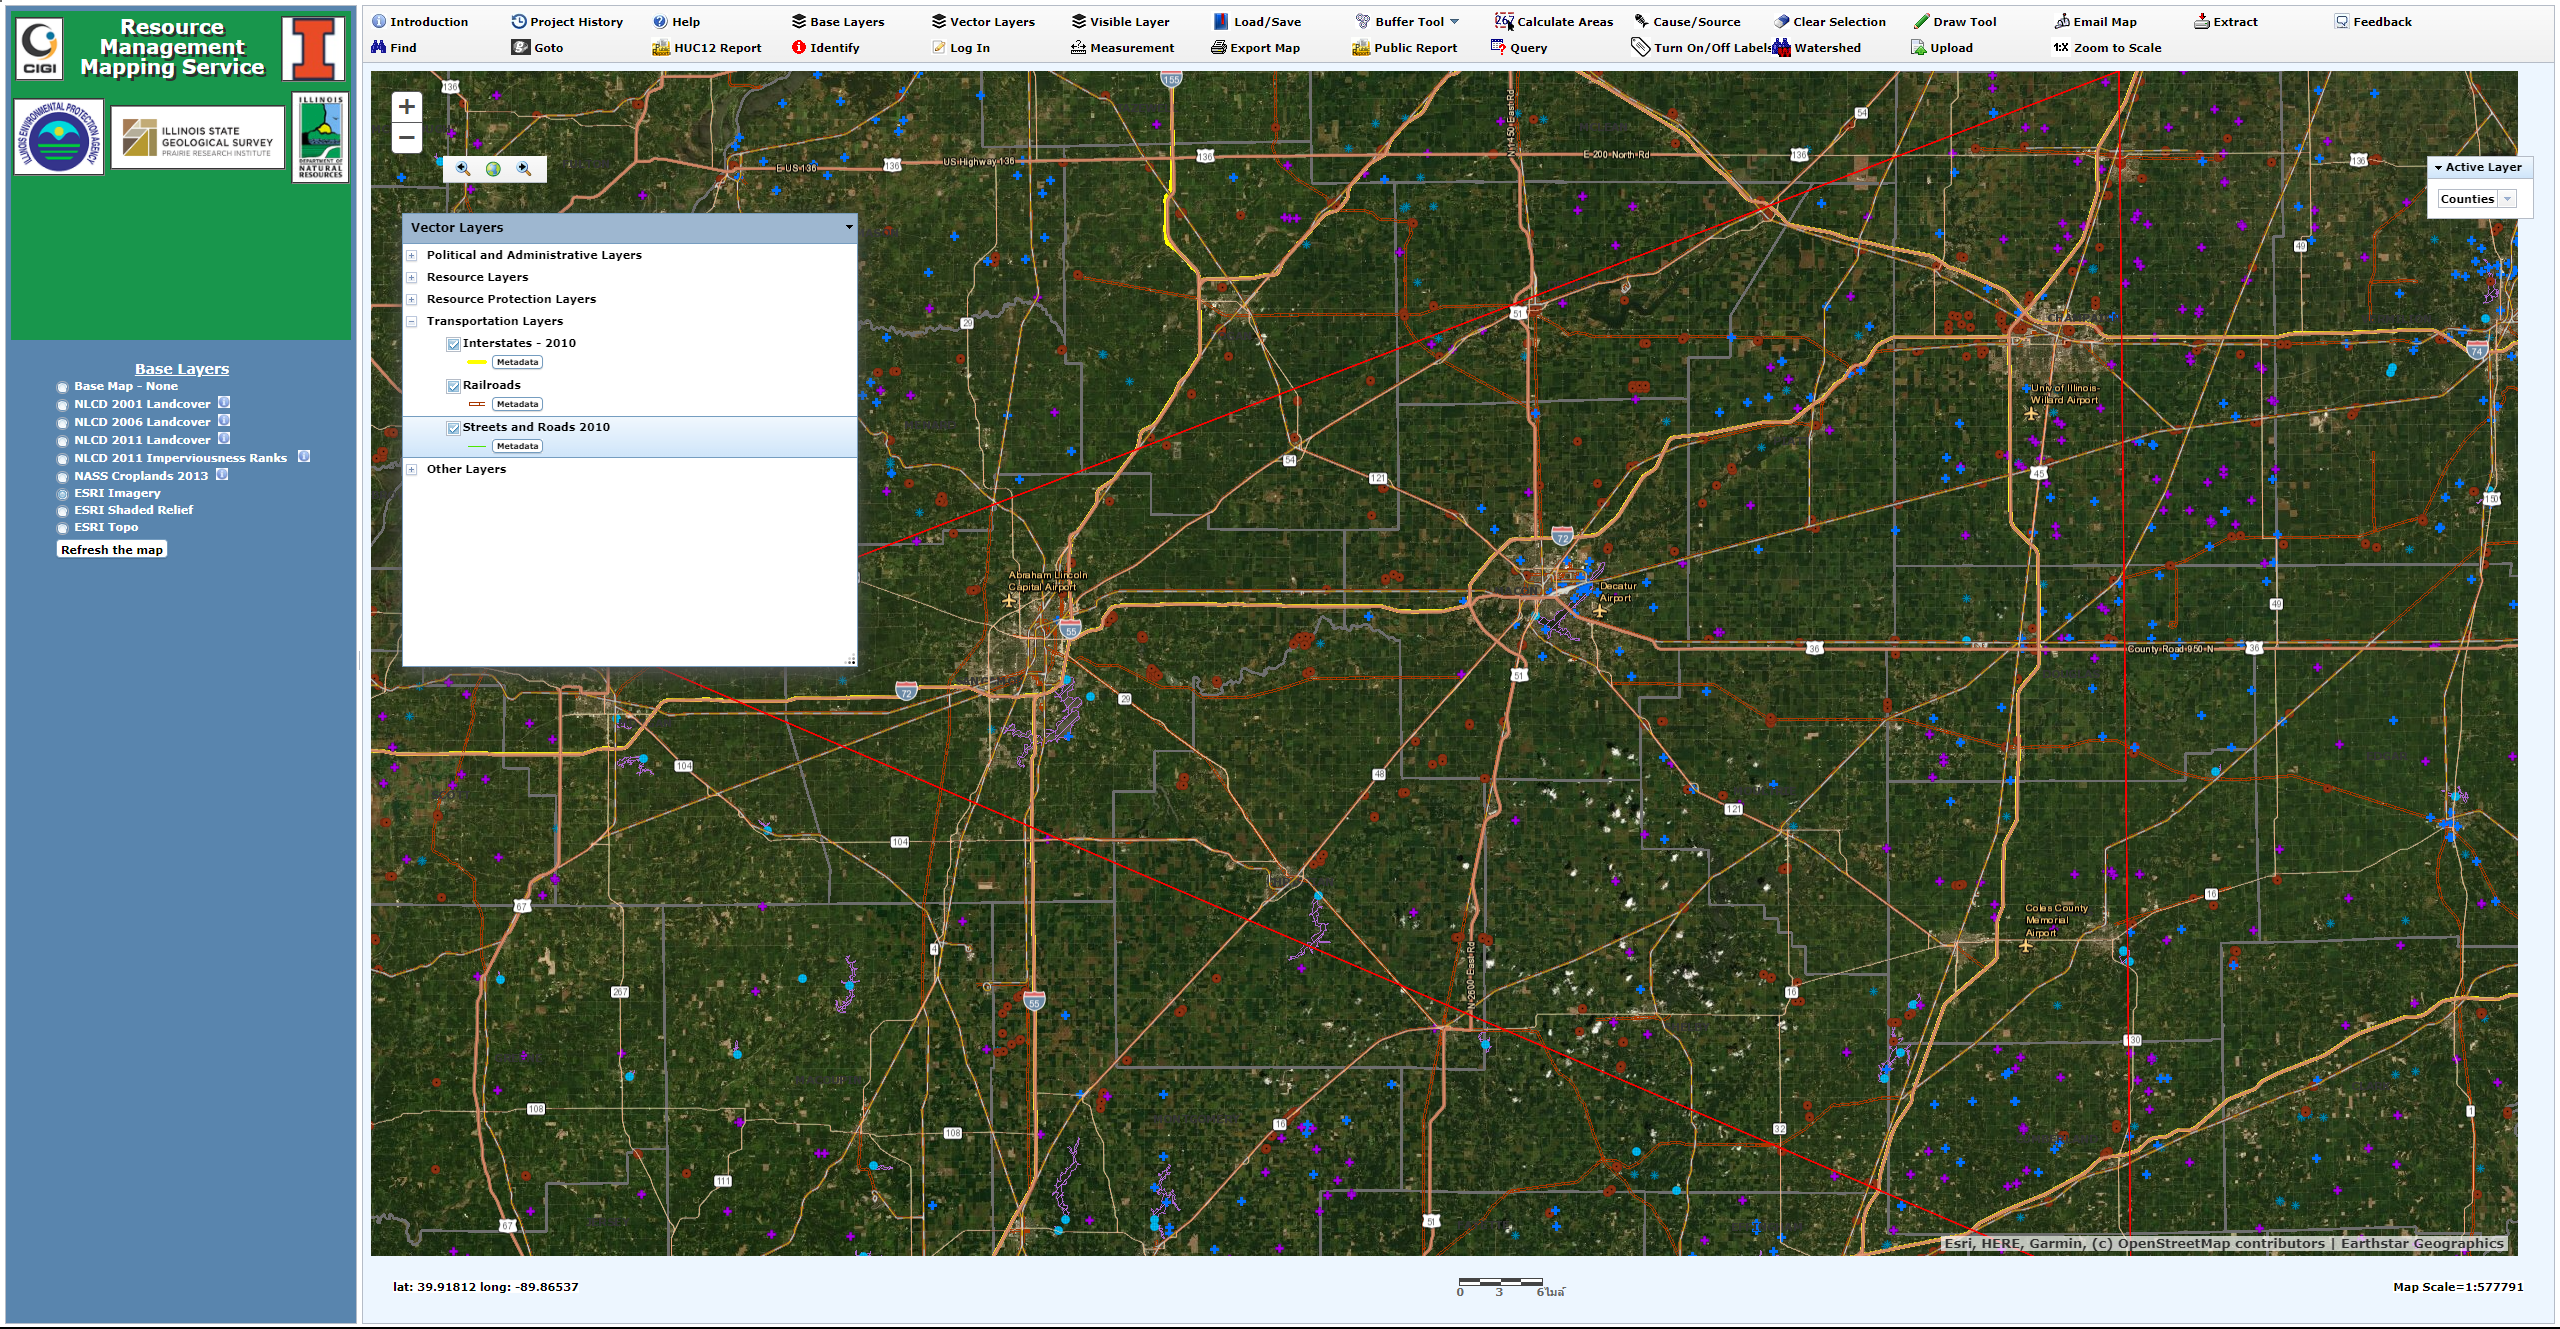
RMMS is a web-based geographic information system (GIS) that makes it easy for the general public, organizations, and decision-makers to obtain environmental information specifically as it relates to watershed management for state and federal programs. Power users such as those from the Illinois Environmental Protection Agency (IEPA) can submit and update data while normal users can examine and interactively map data, perform queries by data type and region, and export both raw data and customized maps.
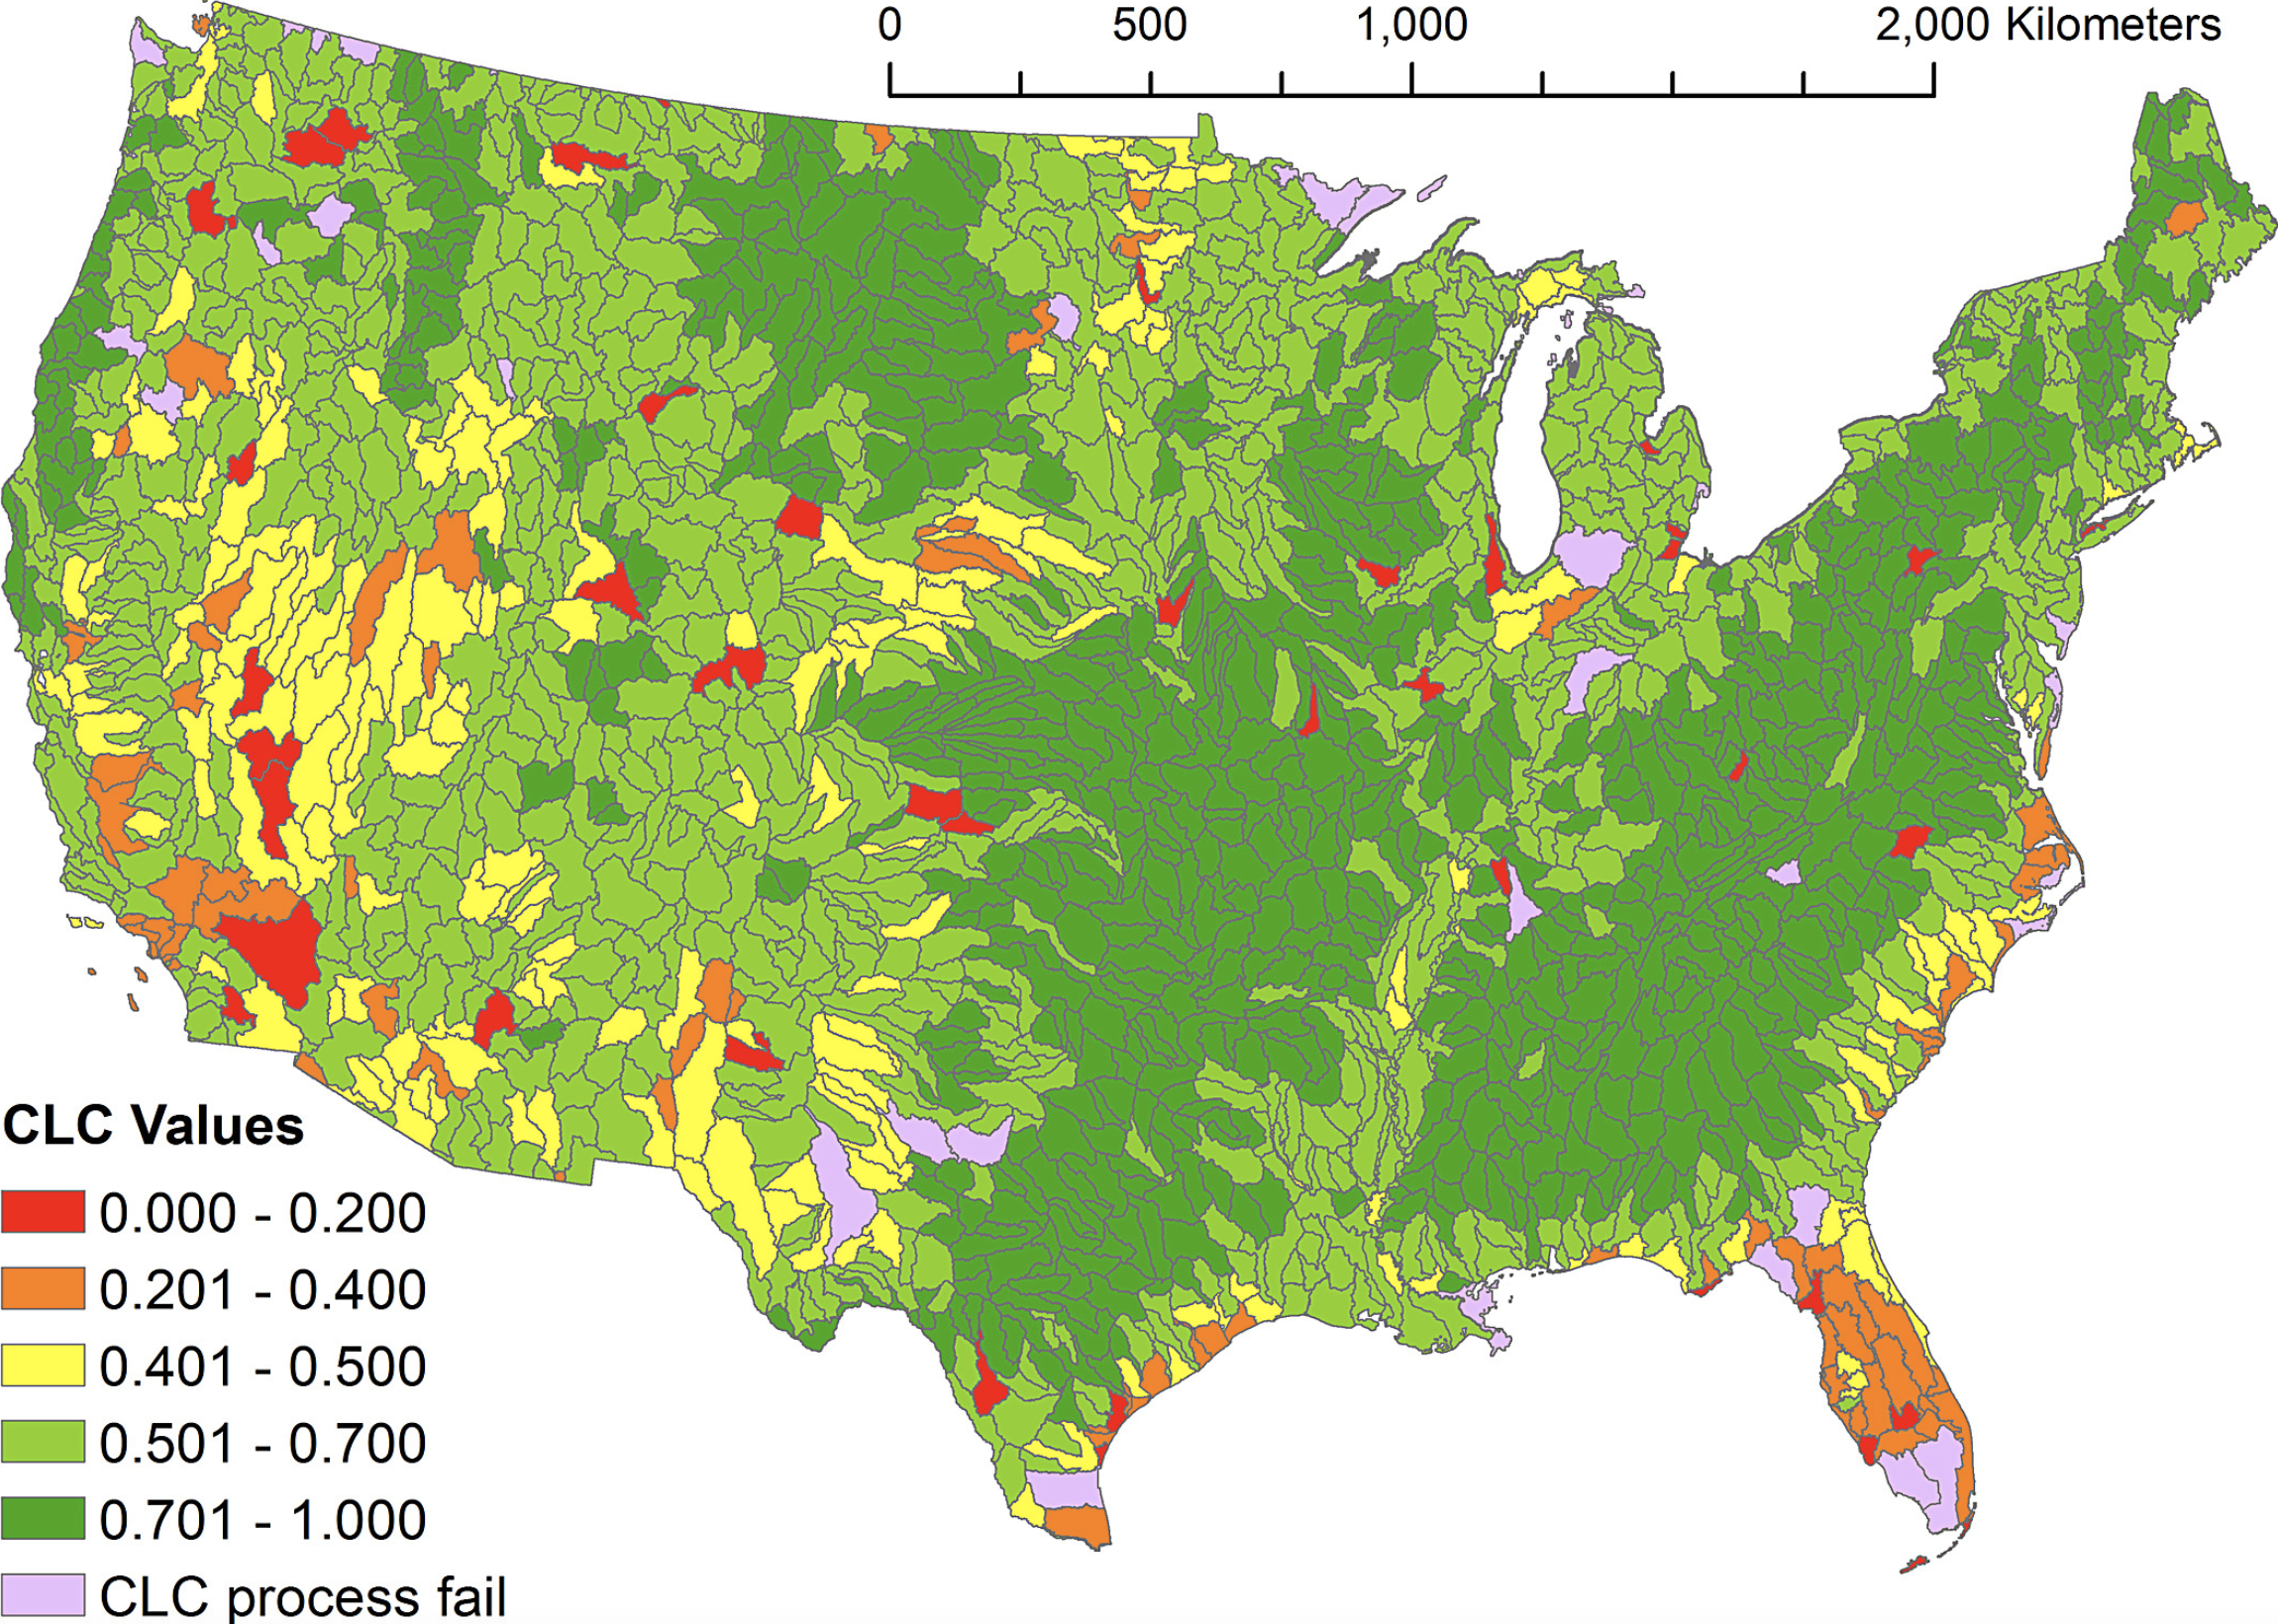
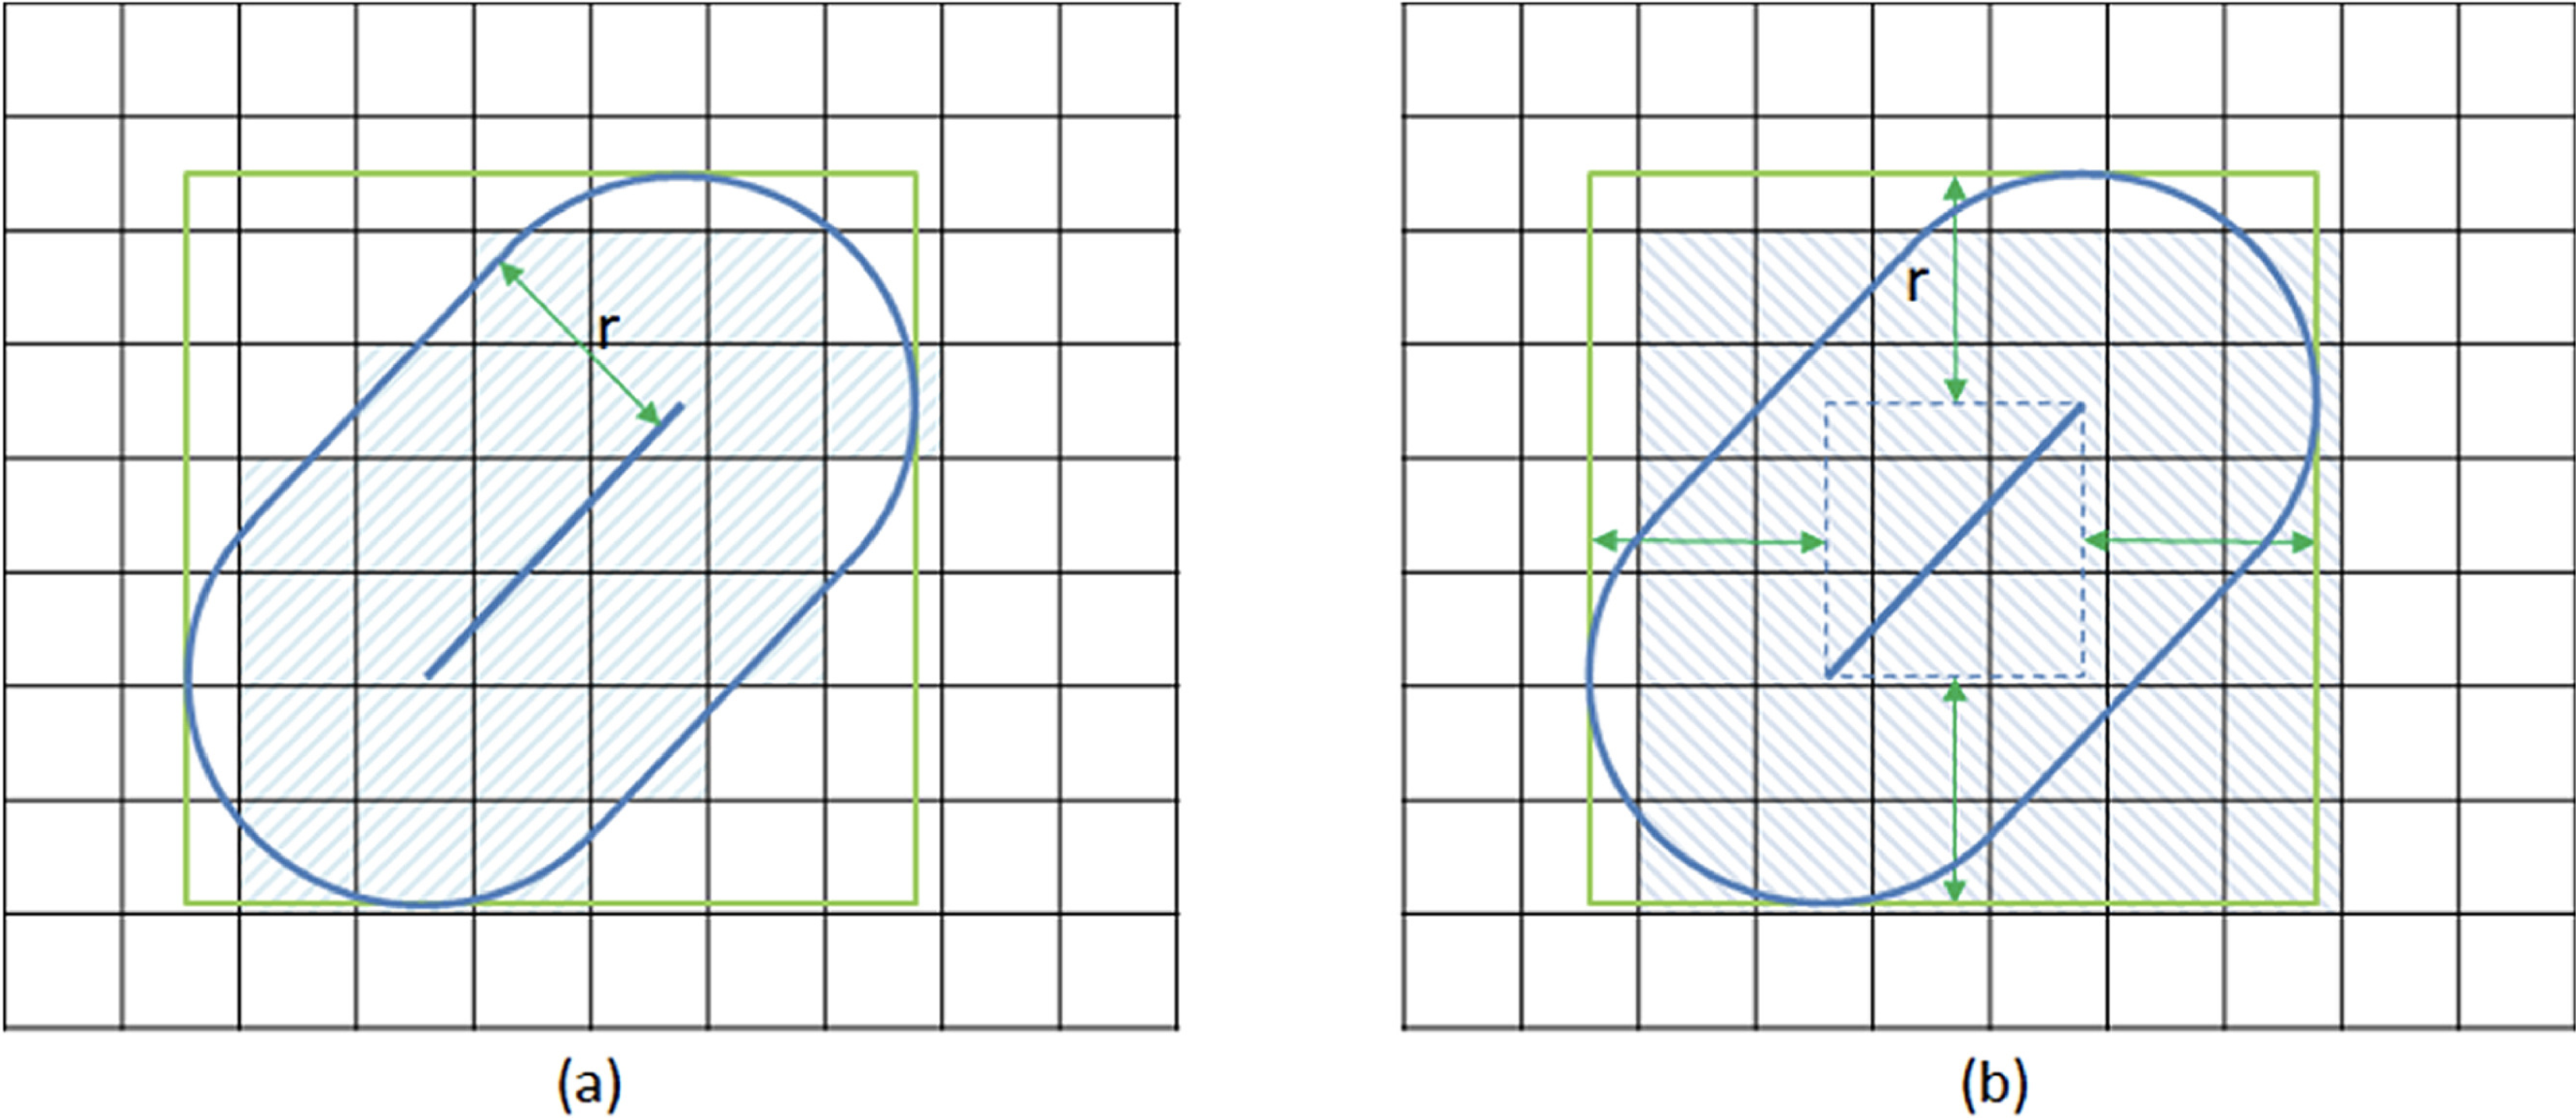
OpenCLC is an open-source software tool to automatically identify matching and mismatching line features between two sets of hydrographic flowlines. Aside from identifying differences among the two versions of NHD lines, results can be applied to improve the quality of NHD HR content. OpenCLC significantly outperforms the best available commercial off-the-shelf software in computational scalability, and it is made widely available as part of the CyberGIS Toolkit to benefit broad environmental and geospatial science communities.
URL: https://github.com/cybergis/cybergis-toolkit/
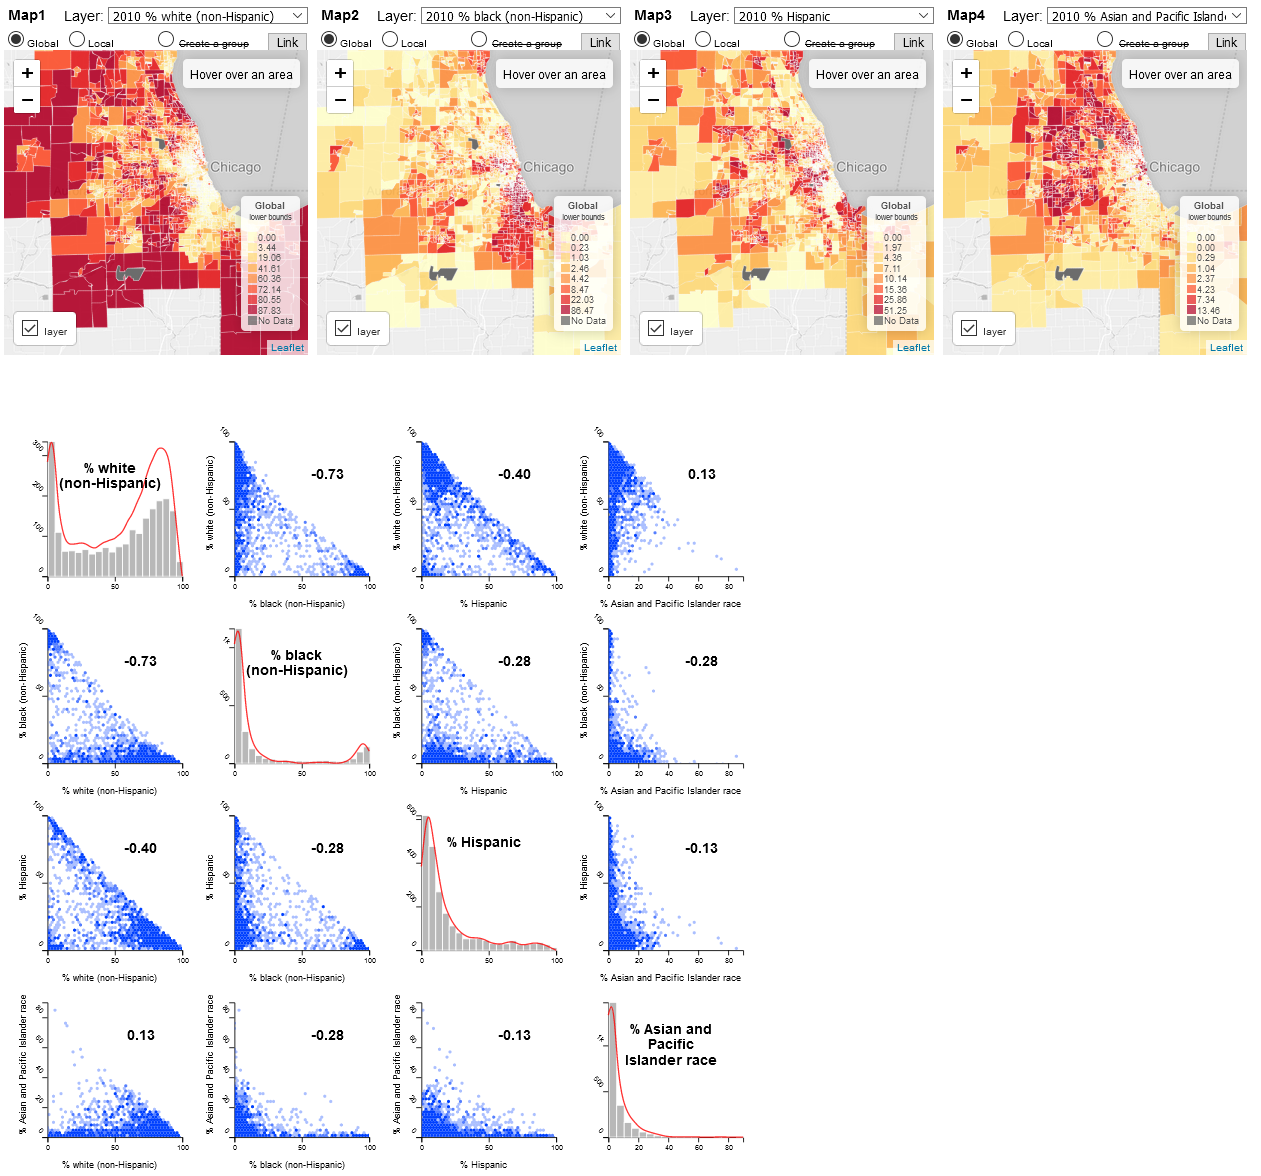
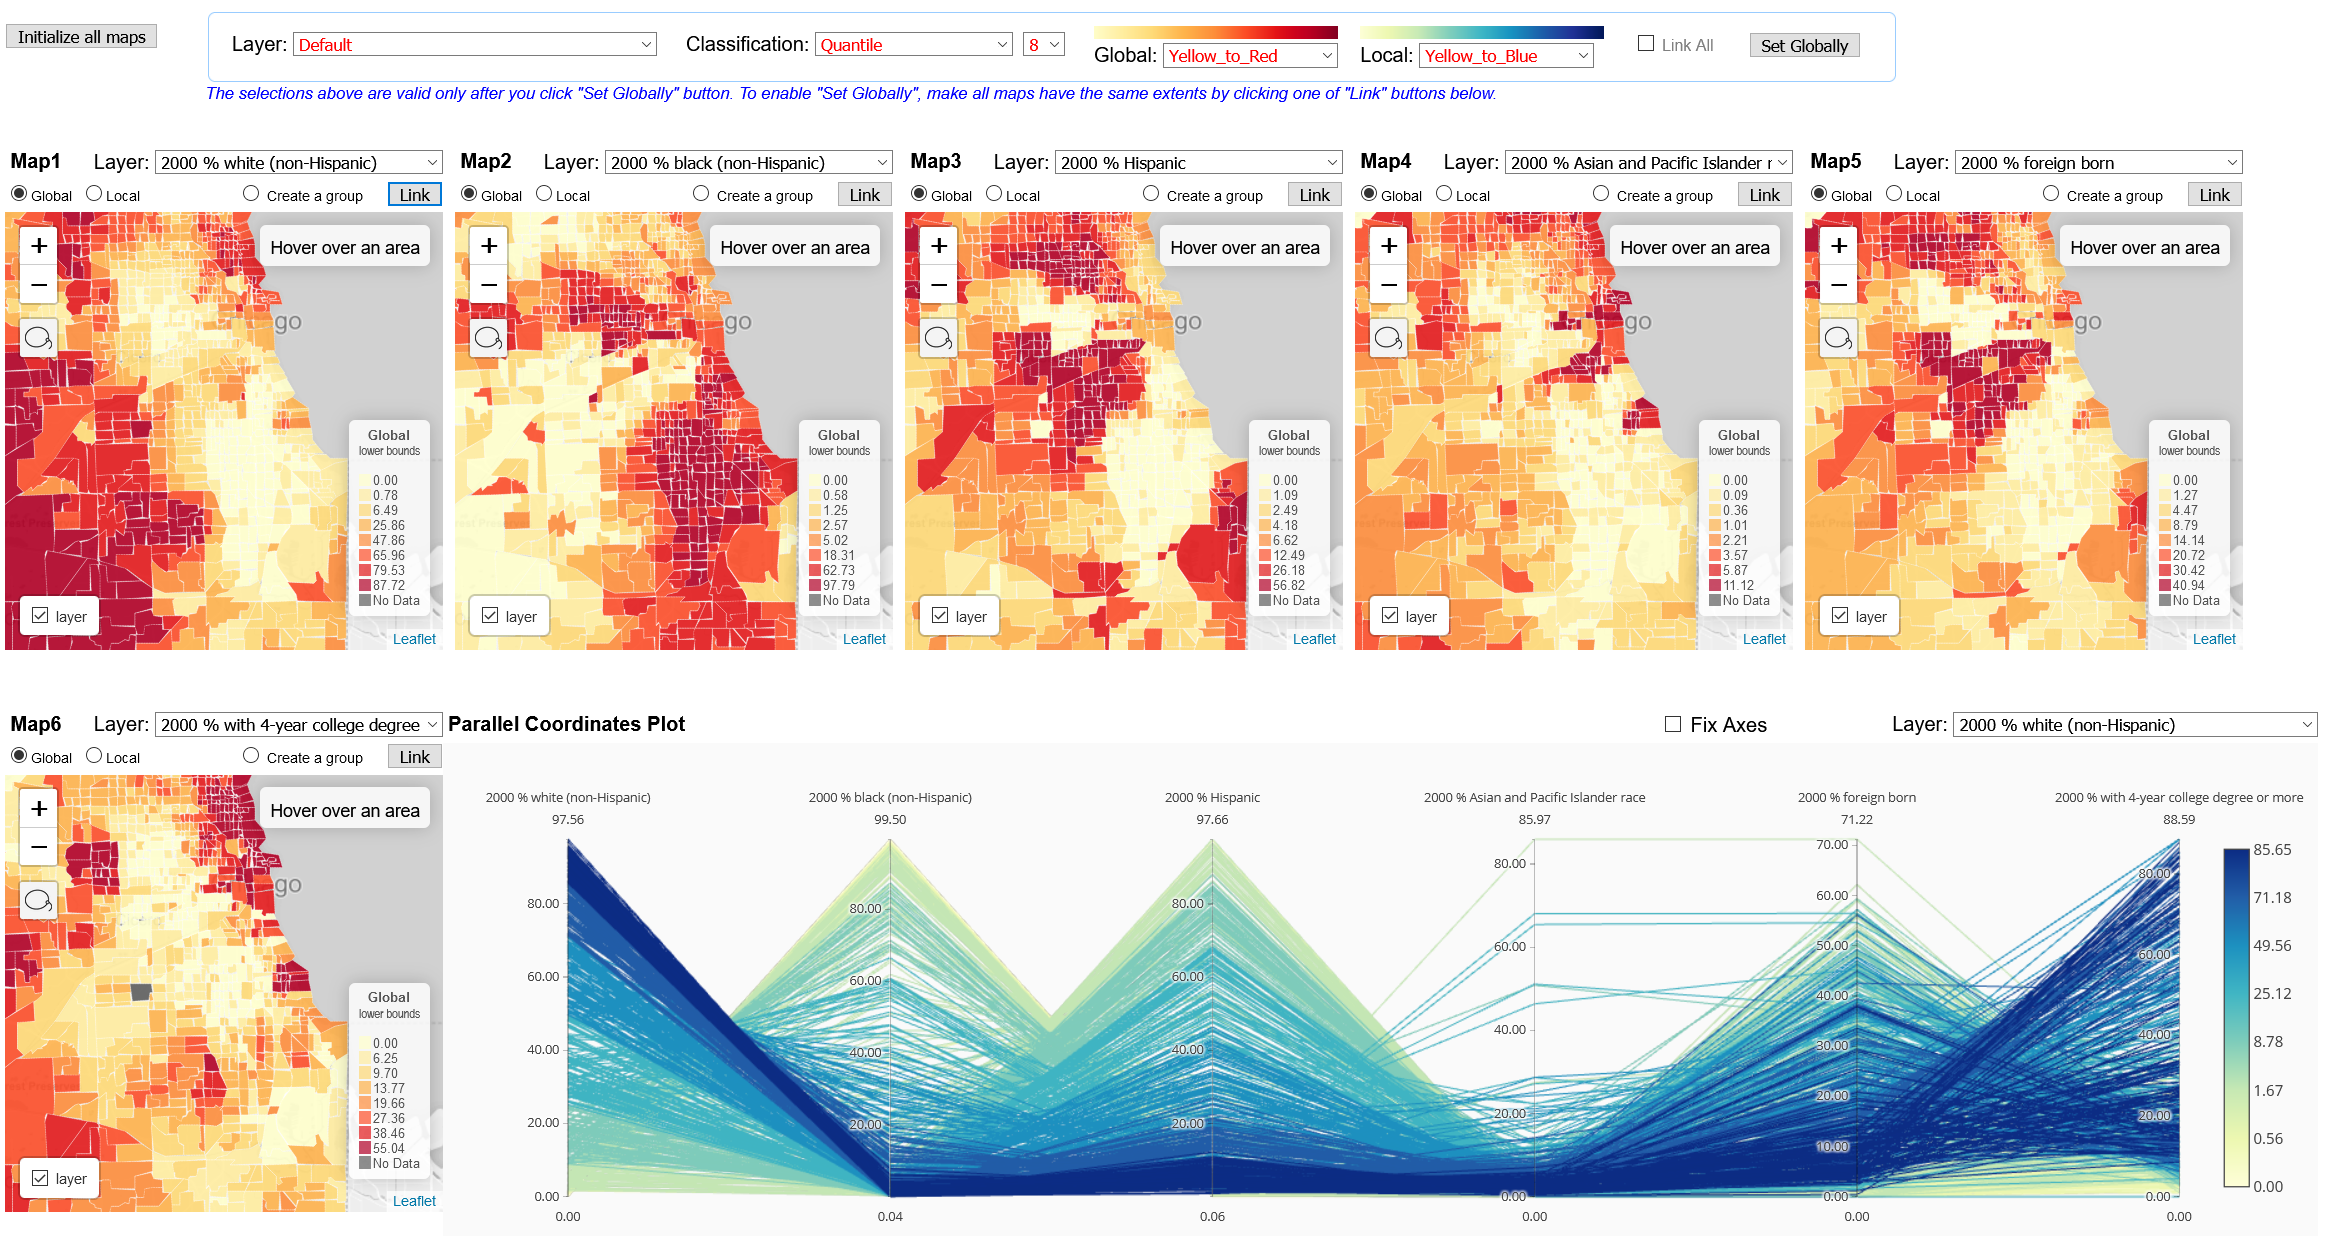
CyberGIS-Vis integrates cutting-edge cyberGIS and online visualization capabilities into a suite of software modules for visualization and visual analytical approaches to knowledge discovery based on geospatial data. Key features of the current CyberGIS-Vis implementation include: (1) comparative visualization of spatiotemporal patterns through choropleth maps; (2) dynamic cartographic mapping linked with charts to explore high-dimensional data; (3) reproducible visual analytics through integration with CyberGIS-Jupyter; and (4) multi-language support including both Python and Javascript.
Source code: https://github.com/cybergis/CyberGIS-Vis
© CyberGIS Center