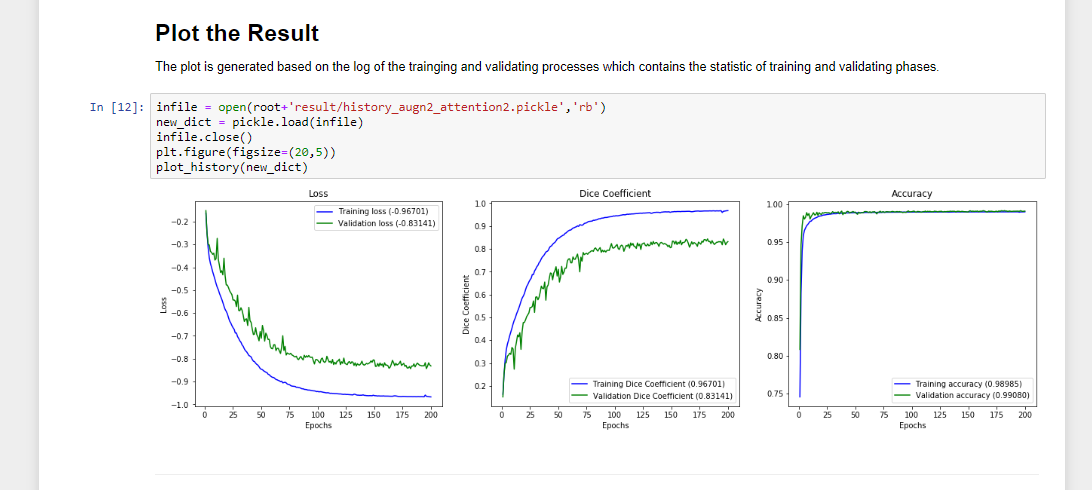
A 3D CNN method to land cover classification using LiDAR and multitemporal imagery
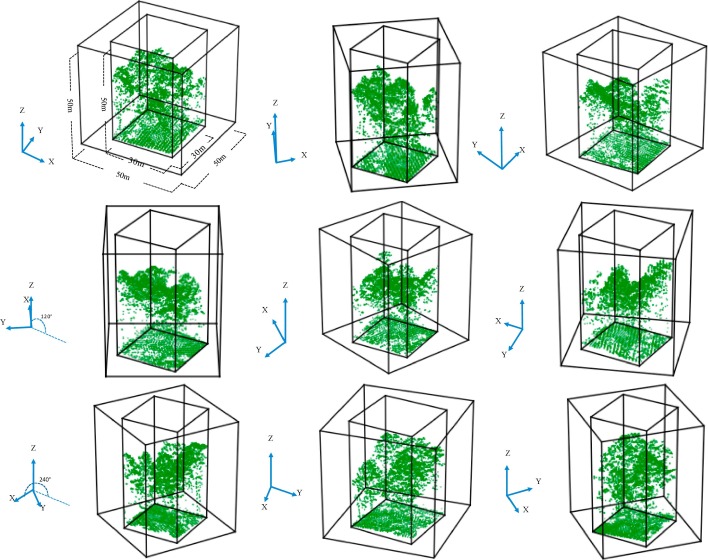
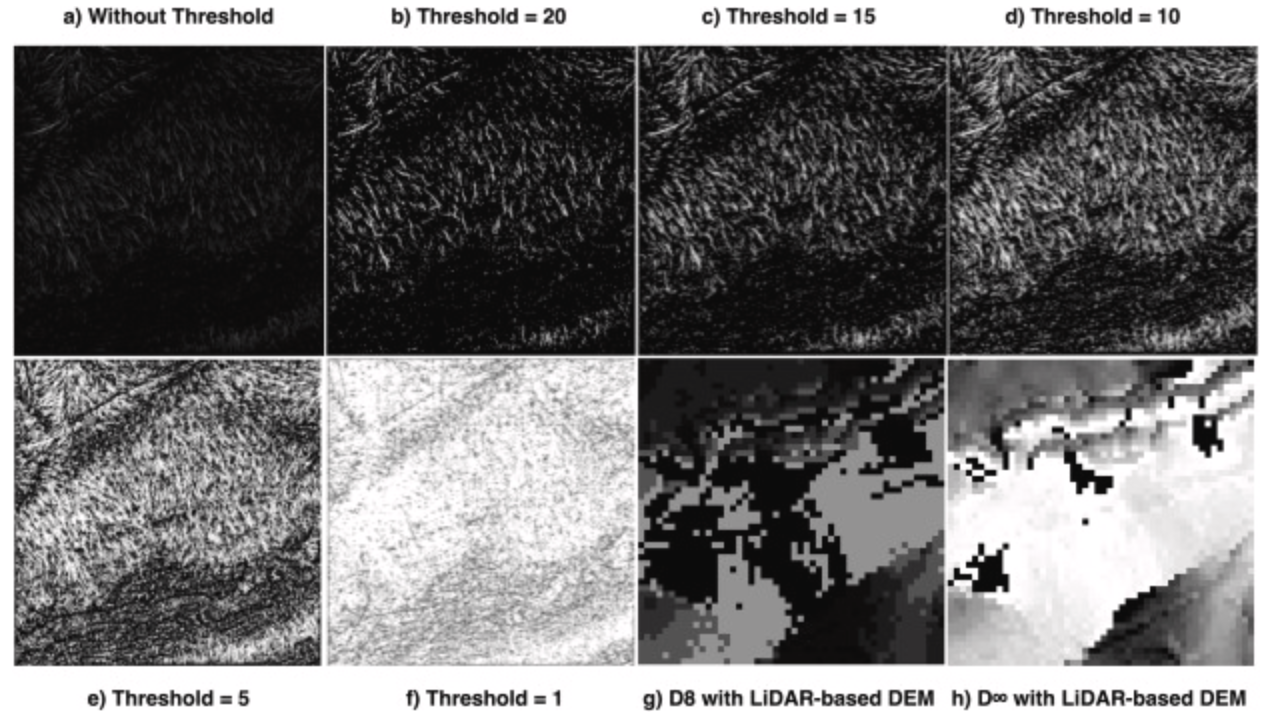
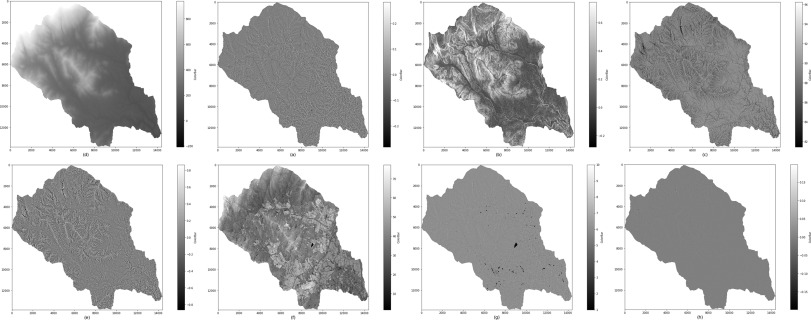
Drainage network analysis is fundamental to understanding the characteristics of surface hydrology. Based on elevation data, drainage network analysis is often used to extract key hydrological features like drainage networks and streamlines. Limited by raster-based data models, conventional drainage network algorithms typically allow water to flow in 4 or 8 directions (surrounding grids) from a raster grid. To resolve this limitation, this paper describes a new vector-based method for drainage network analysis that allows water to flow in any direction around each location. The method is enabled by rapid advances in Light Detection and Ranging (LiDAR) remote sensing and high-performance computing. The drainage network analysis is conducted using a high-density point cloud instead of Digital Elevation Models (DEMs) at coarse resolutions. Our computational experiments show that the vector-based method can better capture water flows without limiting the number of directions due to imprecise DEMs. Our case study applies the method to Rowan County watershed, North Carolina in the US. After comparing the drainage networks and streamlines detected with corresponding reference data from US Geological Survey generated from the Geonet software, we find that the new method performs well in capturing the characteristics of water flows on landscape surfaces in order to form an accurate drainage network.
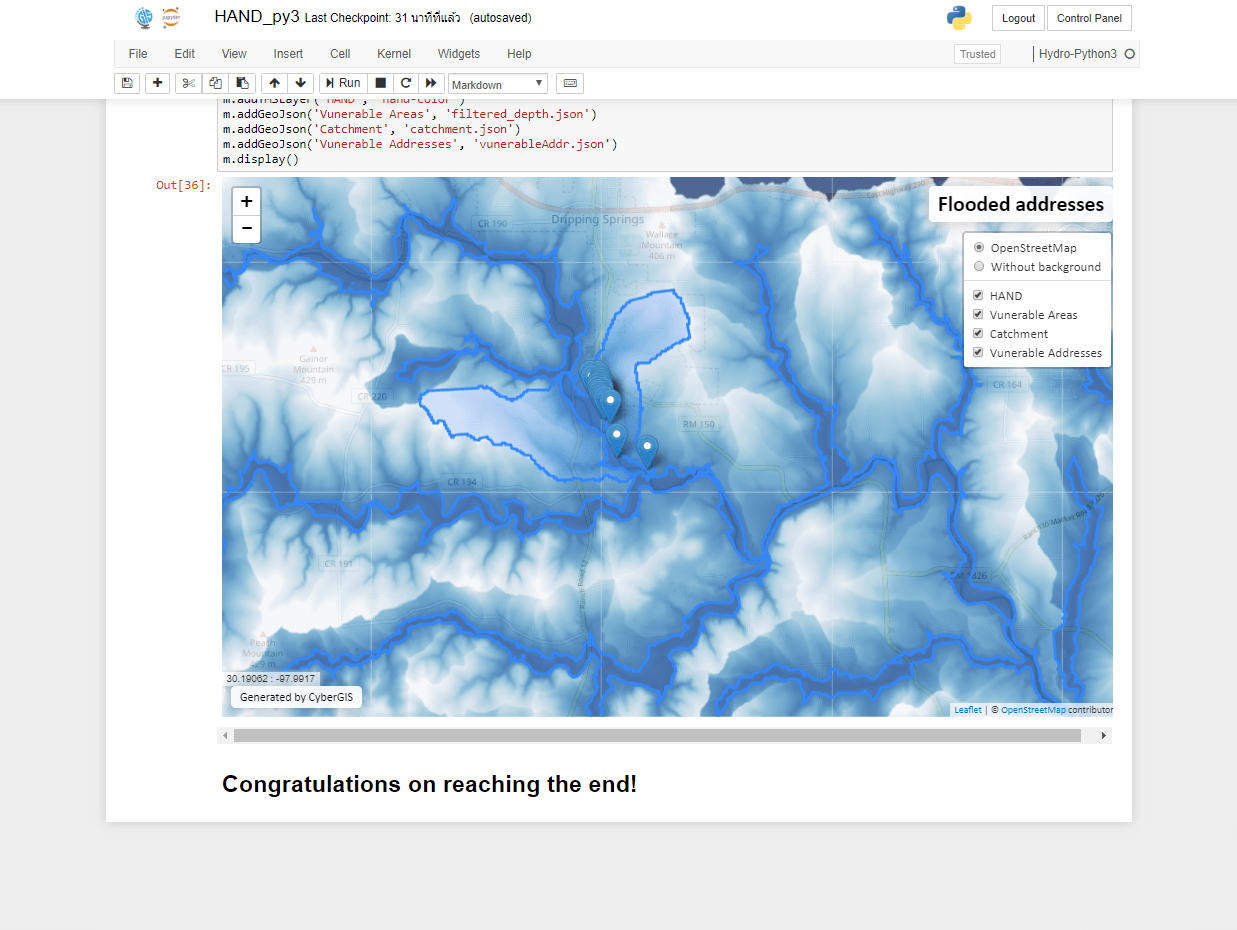
The dataset contains a complete example (inputs, outputs, codes, intermediate results, visualization webpage) of executing Height Above Nearest Drainage HAND workflow with CyberGIS-Jupyter.
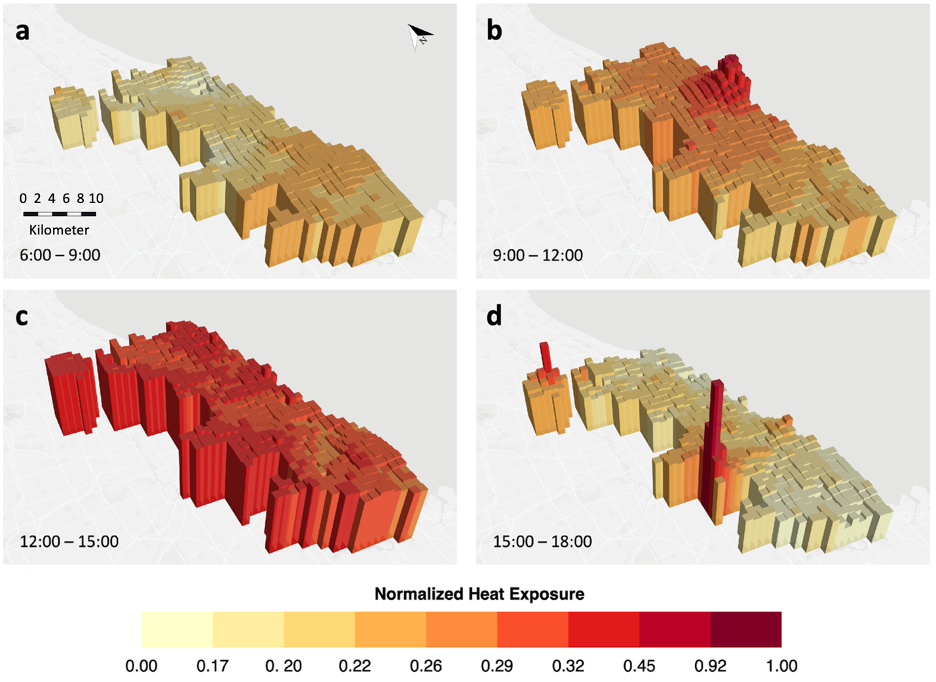
This dataset contains all the datasets used in the study conducted for the research publication titled "Mapping dynamic human sentiments of heat exposure with location-based social media data". This paper develops a cyberGIS framework to analyze and visualize human sentiments of heat exposure dynamically based on near real-time location-based social media (LBSM) data. Large volumes and low-cost LBSM data, together with a content analysis algorithm based on natural language processing are used effectively to generate heat exposure maps from human sentiments on social media.
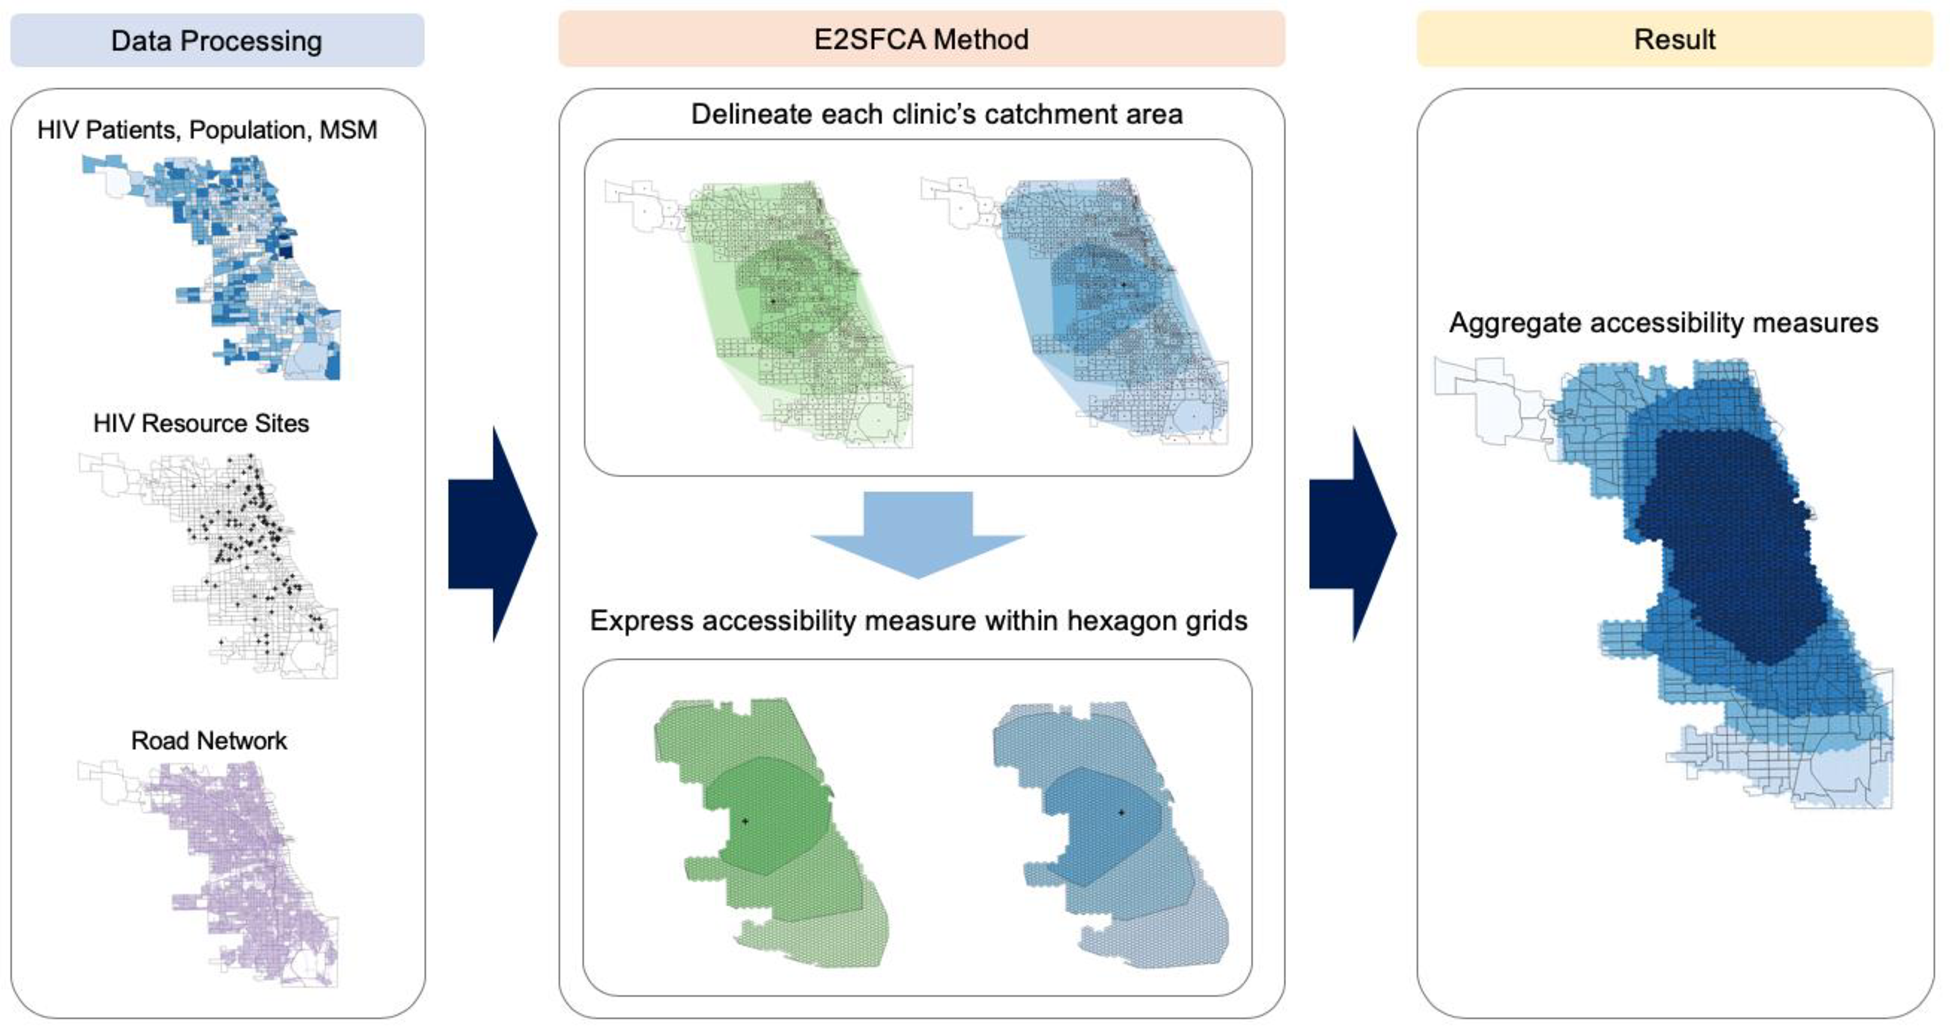
This dataset helps to investigate the Spatial Accessibility to HIV Testing, Treatment, and Prevention Services in Illinois and Chicago, USA. The main components are: population data, healthcare data, GTFS feeds, and road network data. The core components are: 1) `GTFS` which contains GTFS (General Transit Feed Specification) data which is provided by Chicago Transit Authority (CTA) from Google's GTFS feeds. Documentation defines the format and structure of the files that comprise a GTFS dataset: https://developers.google.com/transit/gtfs/reference?csw=1. 2) `HealthCare` contains shapefiles describing HIV healthcare providers in Chicago and Illinois respectively. The services come from Locator.HIV.gov. 3) `PopData` contains population data for Chicago and Illinois respectively. Data come from The American Community Survey and AIDSVu. AIDSVu (https://map.aidsvu.org/map) provides data on PLWH in Chicago at the census tract level for the year 2017 and in the State of Illinois at the county level for the year 2016. The American Community Survey (ACS) provided the number of people aged 15 to 64 at the census tract level for the year 2017 and at the county level for the year 2016. The ACS provides annually updated information on demographic and socio economic characteristics of people and housing in the U.S. 4) `RoadNetwork` contains the road networks for Chicago and Illinois respectively from OpenStreetMap using the Python osmnx package.
Training, validation, and testing data of LiDAR-derived feature maps for hydrological streamline detection of Rowan County and Covington watersheds acquired from USGS
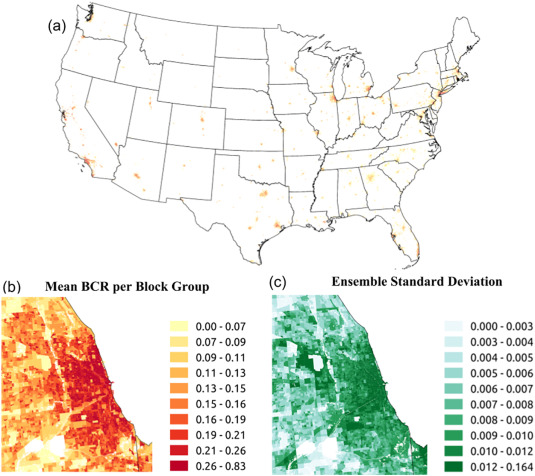
A complete building coverage area dataset (i.e. area occupied by building structures, excluding other built surfaces such as roads, parking lots, and public parks) at the level of census block groups for the contiguous United States (CONUS). The dataset was assembled based on an ensemble prediction of nonlinear hierarchical models to account for spatial heterogeneities in the distribution of built surfaces across different urban communities. Percentage of impervious land and housing density were used as predictors of the estimated area of buildings and cross-validation results showed that the product estimated area represented by buildings with a mean error of 0.049 %.
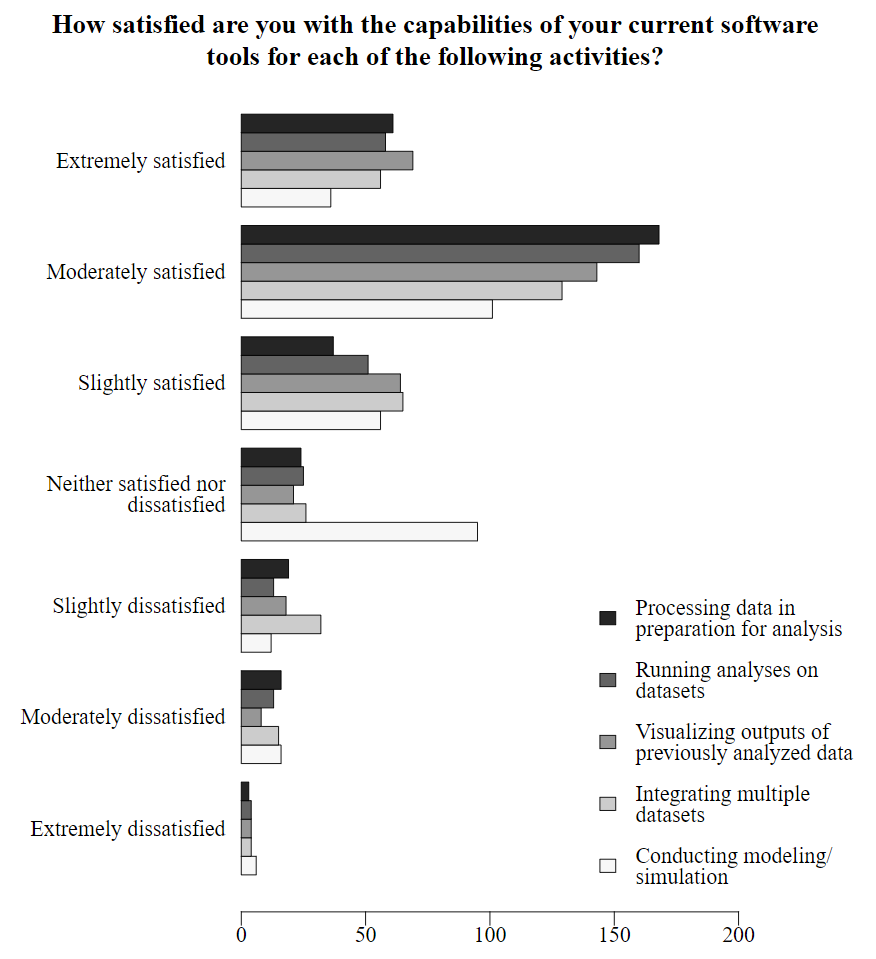
This dataset contains R codes used to produce the figures submitted in the manuscript titled "Understanding the multifaceted geospatial software ecosystem: a survey approach". The raw survey data used to populate these charts cannot be shared due to the survey consent agreement.
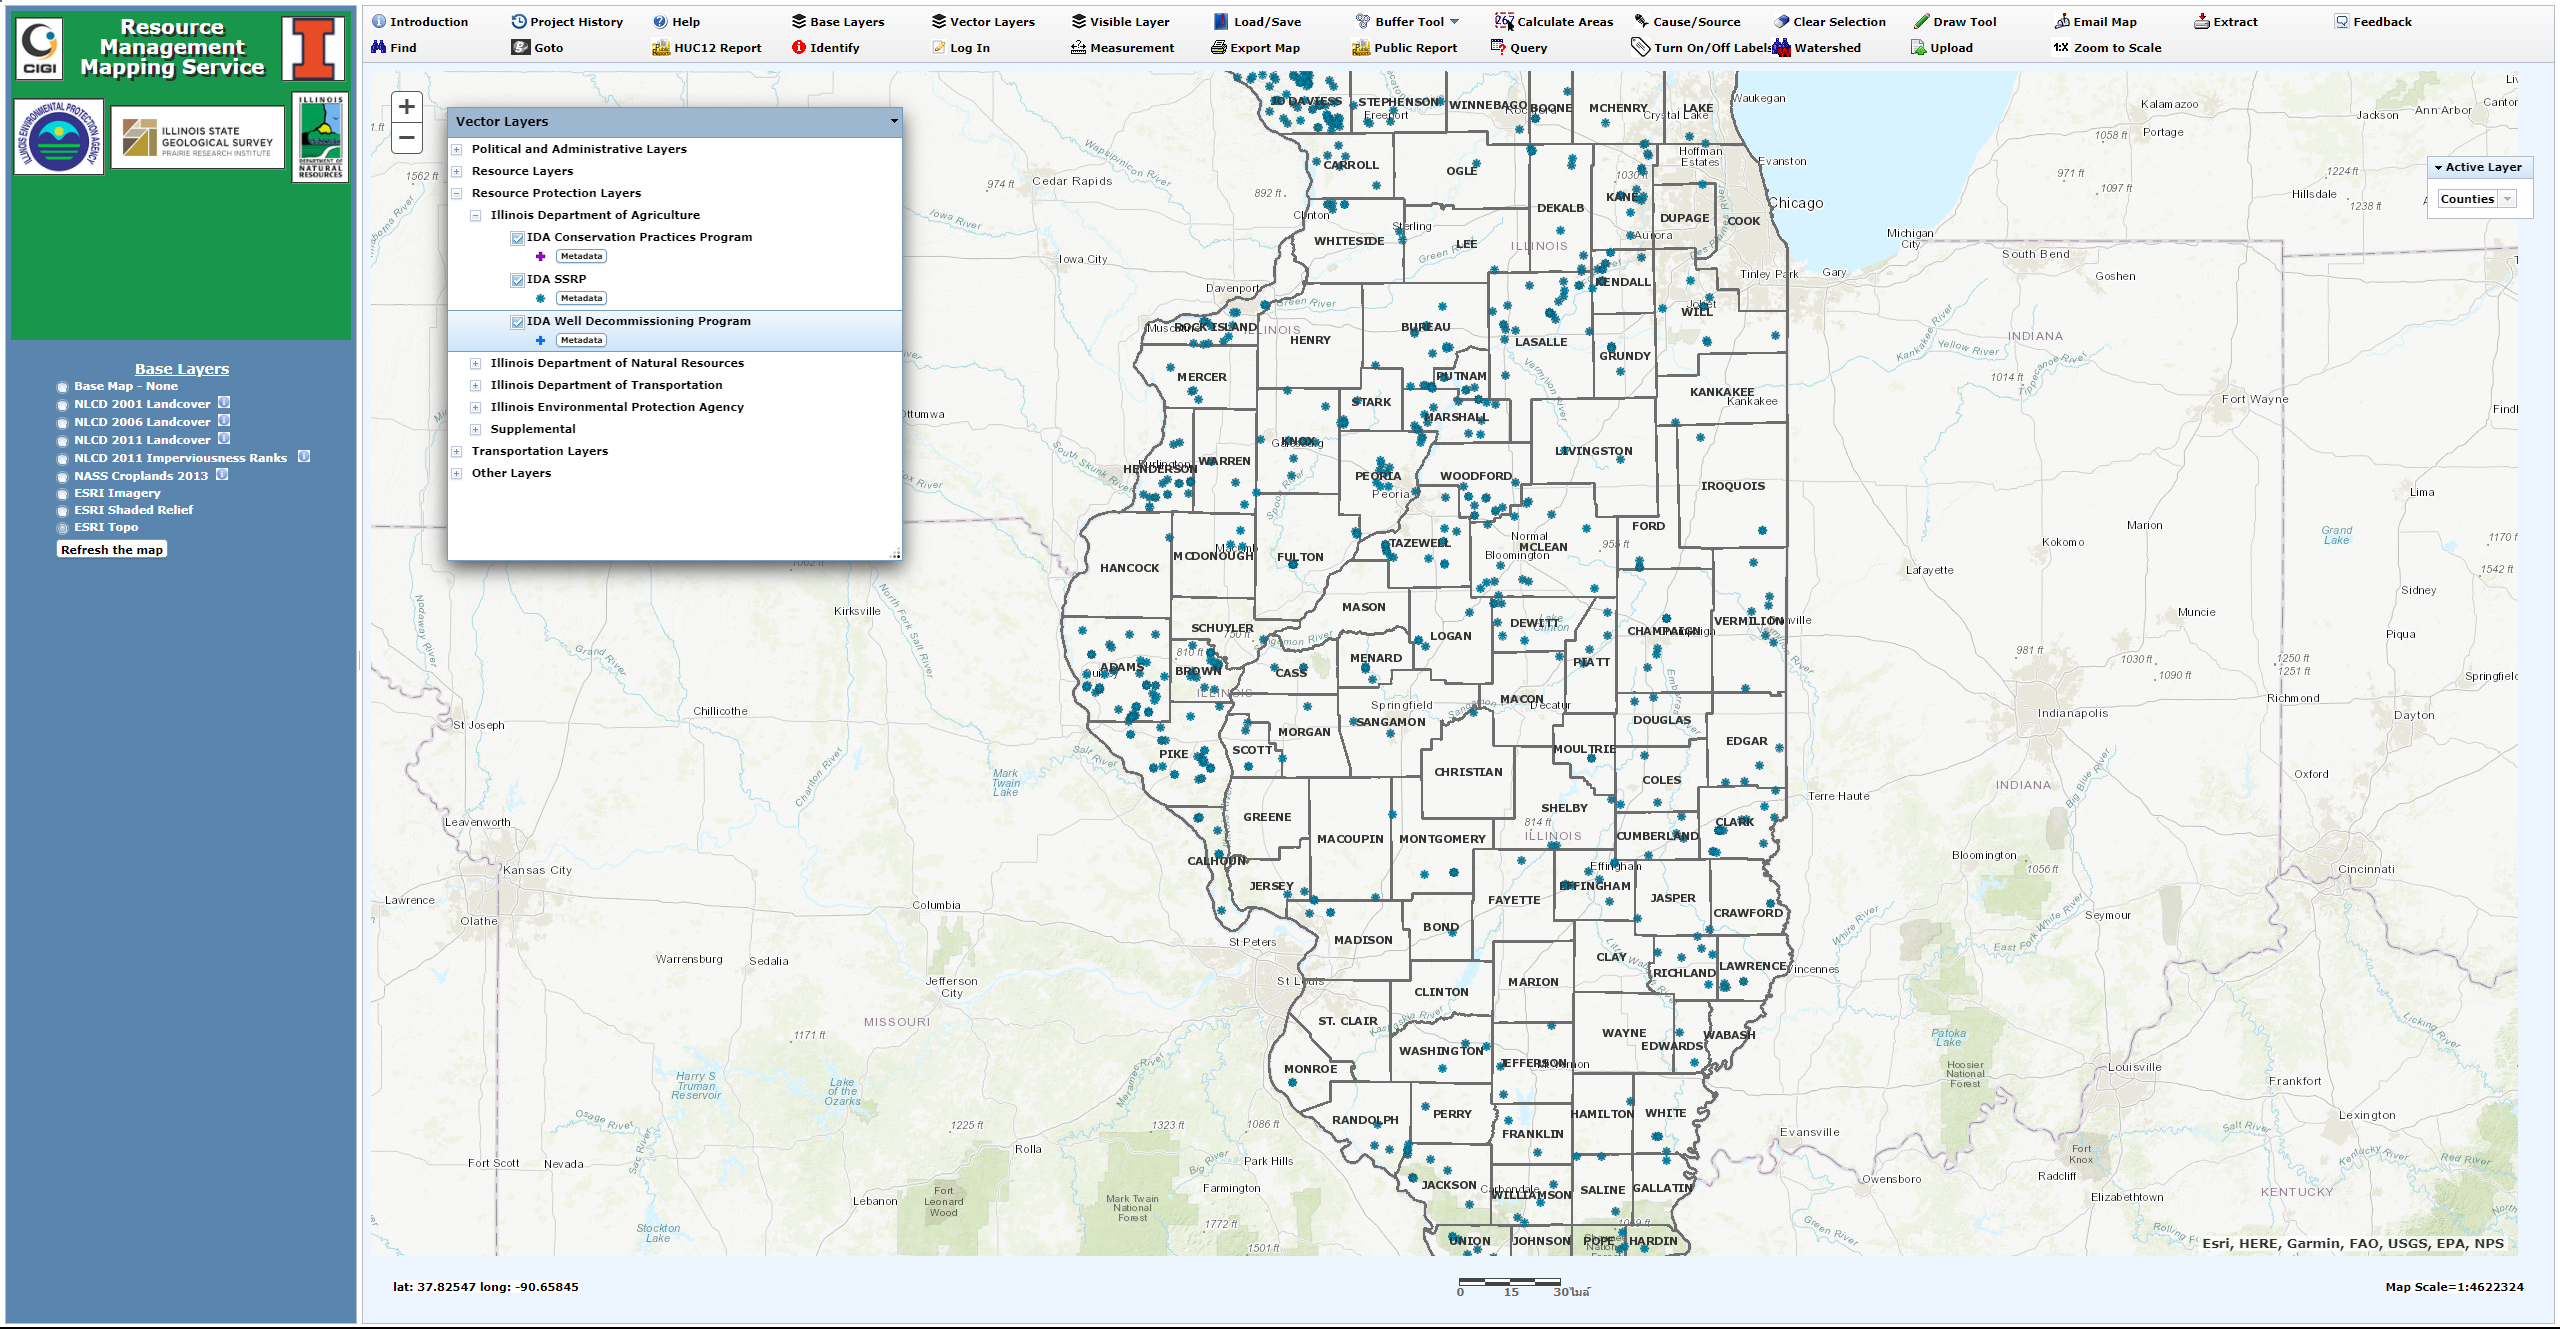
RMMS is a web-based geographic information system (GIS) that makes it easy for the general public, organizations and decision-makers to obtain environmental data specifically as it relates to watershed management for state and federal programs. Environmental and associated data accessible through RMMS Website (https://www.rmms.illinois.edu/) may be classified into the following broad categories Political and Administrative Data (e.g. Congressional Districts, PLSS, Townships). Resources Data (e.g. Community Water Supply, Ground water, Soils and Geology, Surface Water, Watersheds). Resource Protection Data from various state agencies like Illinois Department of Agriculture (e.g. IDA Well Decommissioning Program), Illinois Department of Natural Resources (e.g. IDNR Conservation Opportunity Areas), Illinois Environmental Protection Agency (e.g. IEPA Coal Ash Ponds), Illinois Department of Transportation (e.g. IDOT Prairie Inventory). A complete list of all the data layers along with associated metadata can be found at https://www.rmms.illinois.edu/iepa/rest/services/rmms_full/MapServer
Training, validition, and testing data of LiDAR derived feature maps for hydrological streamline detection of Rowan county watershed acquired from USGS (author: Larry Stanislawski (lstan@usgs.gov) and Ethan Shavers (eshavers@usgs.gov)).
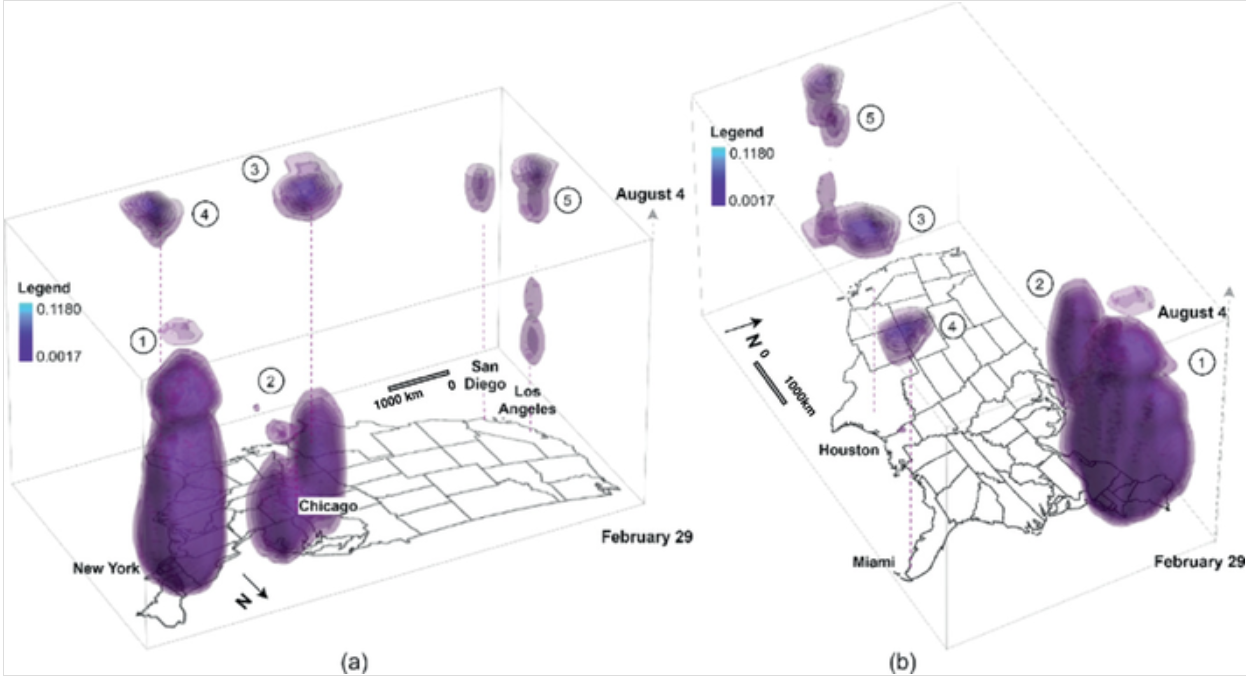
This dataset contains all the code, notebooks, datasets used in the study conducted for the research publication titled "Multi-scale CyberGIS Analytics for Detecting Spatiotemporal Patterns of COVID-19 Data". Specifically, this package include the artifacts used to conduct spatial-temporal analysis with space time kernel density estimation (STKDE) using COVID-19 data, which should help readers to reproduce some of the analysis and learn about the methods that were conducted in the associated book chapter.
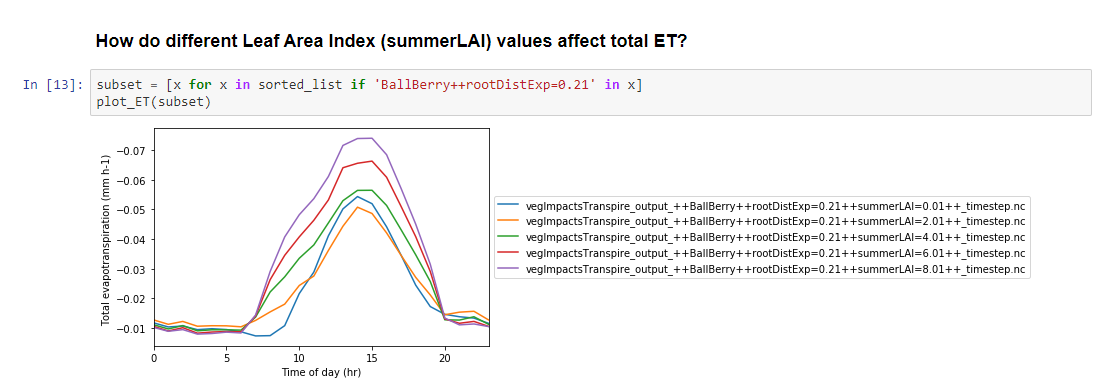
This example is to show the steps to run an ensemble SUMMA3.0 on HPC through the CyberGIS Computing Service.
This dataset contains all the code, notebooks, datasets used in the study conducted to measure the spatial accessibility of COVID-19 healthcare resources with a particular focus on Illinois, USA. Specifically, the dataset measures spatial access for people to hospitals and ICU beds in Illinois. The spatial accessibility is measured by the use of an enhanced two-step floating catchment area (E2FCA) method (Luo & Qi, 2009), which is an outcome of interactions between demands (i.e, # of potential patients; people) and supply (i.e., # of beds or physicians). The result is a map of spatial accessibility to hospital beds. It identifies which regions need more healthcare resources, such as the number of ICU beds and ventilators. This notebook serves as a guideline of which areas need more beds in the fight against COVID-19.
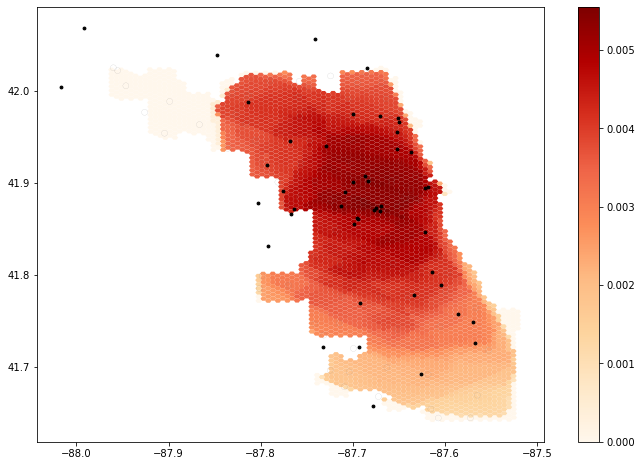
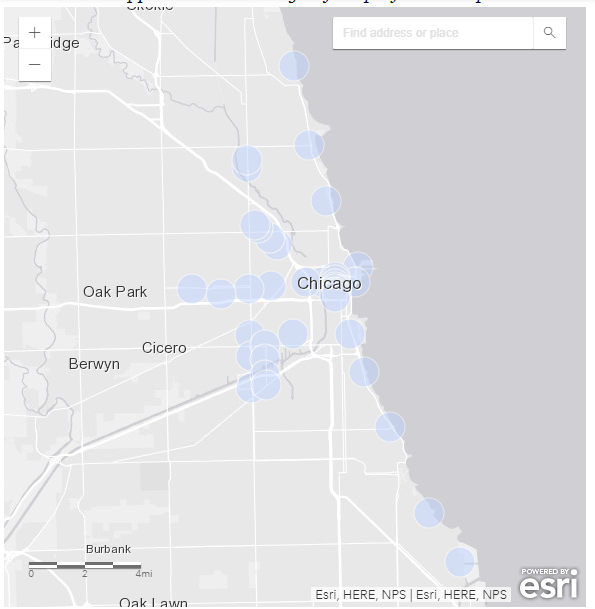
This is the notebook and data for using CyberGISX to conduct analysis using Array of Things (AoT) data in the Chicago area. The first notebook illustrates the spatial interpolation of temperature in the Chicago area using the dataset. And the second notebook helps to explore the dataset.
© CyberGIS Center